MA indicator
Hi Guys.
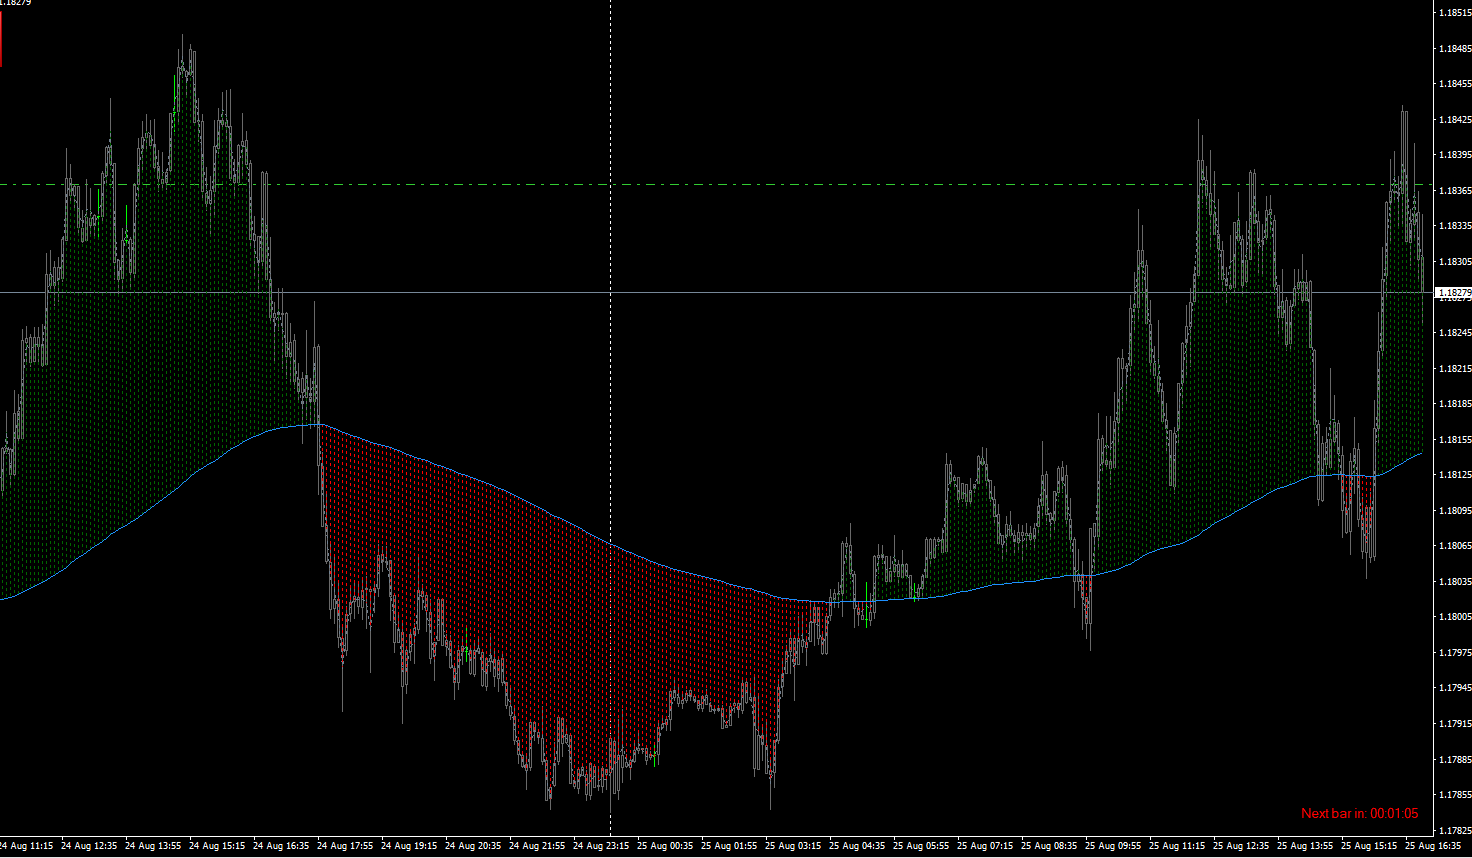
Has anyone come across a moving average histogram but with the added condition if price is above or below the moving average?
I read your post at another forum too with the same inquiry,the best way to explain your query demonstrate with explaining picture/s
Hi Guys.
Has anyone come across a moving average histogram but with the added condition if price is above or below the moving average?
Something like this histogram?

I read your post at another forum too with the same inquiry,the best way to explain your query demonstrate with explaining picture/s
Thank you for your reply, iv looked everywhere to try and find it. its basically the attached indicator. the histogram is over the main chart, im after a version with the histogram in the a separate box at the bottom, so i can read the buffers. because i cant seem to read the buffers from this indicator
after messing with so many indicator and so many setting for hours and hours. i found it is basically a moving average with periods of 160 and 1 with an added rule of price being under the MA or above.
I have tried getting in touch with the guy you made it, but no joy.
<ex4 file deleted>
Something like this histogram?
Hi Mate,
Thank you for your reply,
Thats really close to what i need, but with 2ma and just red or green histogram rather then changing hights, because i found they repaint
Hi Mate,
Thank you for your reply,
Thats really close to what i need, but with 2ma and just red or green histogram rather then changing hights, because i found they repaint
So you want the difference of the 2 Ma's in points basically (programmatically) and the visuals with the histogram on the separate window like @Vladimir Karputov showed
Try This , it has no separate window ,you can access the distance of the ma's in points with buffer 4 (if you know how)
#property copyright "Thread In Mql5.com"
#property link      "https://www.mql5.com/en/forum/349494"
#property description "Telegram  : https://t.me/lorentzor\nInstagram : @rlorentzo\nTwitter : @lorentzo_r\nLinkedIn : https://www.linkedin.com/in/lorentzor\nYoutube : https://www.youtube.com/channel/UCM0Lj06cAJagFWvSpb9N5zA\nFacebook  : @LorentzoR"
/*
ways to connect .> :
Telegram  : https://t.me/lorentzor
Instagram : https://www.instagram.com/rlorentzo /OR/ @rlorentzo
Twitter   : https://twitter.com/lorentzo_r /OR/ @lorentzo_r
LinkedIn  : https://www.linkedin.com/in/lorentzor
Youtube   : https://www.youtube.com/channel/UCM0Lj06cAJagFWvSpb9N5zA
Facebook  : https://www.facebook.com/LorentzoR /OR/ @LorentzoR
Mql5.com  : https://www.mql5.com/en/users/lorio
*/
#property version   "1.00"
#property strict
#property strict
#property indicator_chart_window
#property indicator_buffers 5
#property indicator_plots   4
input int SlowMaPeriod=100;//Slow MA Period
input ENUM_MA_METHOD SlowMaMethod=MODE_SMA;//Slow MA Method
input int SlowMaShift=0;//Slow MA Shift
input ENUM_APPLIED_PRICE SlowMaPrice=PRICE_TYPICAL;//Slow MA Price
input int FastMaPeriod=50;//Fast MA Period
input ENUM_MA_METHOD FastMaMethod=MODE_SMA;//Fast MA Method
input int FastMaShift=0;//Fast MA Shift
input ENUM_APPLIED_PRICE FastMaPrice=PRICE_TYPICAL;//Fast MA Price
input string notea="[---]";//Display Stuff
input color FastMaColor=clrRoyalBlue;//Fast Ma Color
input int   FastMaWidth=2;//Fast Ma Width
input ENUM_LINE_STYLE FastMaStyle=STYLE_SOLID;//Fast Ma Style
input color SlowMaColor=clrCrimson;//Slow Ma Color
input int   SlowMaWidth=2;//Slow Ma Width
input ENUM_LINE_STYLE SlowMaStyle=STYLE_SOLID;//Slow Ma Style
input color UpHistoGramColor=clrDodgerBlue;//Up Histogram Color
input int   UpHistoGramWidth=1;//Up Histogram Width
input ENUM_LINE_STYLE UpHistoGramStyle=STYLE_SOLID;//Up Histogram Style
input color DwHistoGramColor=clrOrangeRed;//Down Histogram Color
input int   DwHistoGramWidth=1;//Down Histogram Width
input ENUM_LINE_STYLE DwHistoGramStyle=STYLE_SOLID;//Down Histogram Style
//--- indicator buffers
double         FastMa[],SlowMa[];
double         MaDistanceInPoints[];
double         HistaboveBuffer[];
double         HistobelowBuffer[];
int BarDeflekt=0;
//+------------------------------------------------------------------+
//| Custom indicator initialization function                         |
//+------------------------------------------------------------------+
int OnInit()
  {
//--- indicator buffers mapping
   SetIndexBuffer(0,HistaboveBuffer);
   SetIndexBuffer(1,HistobelowBuffer);
   SetIndexStyle(0,DRAW_HISTOGRAM,UpHistoGramStyle,UpHistoGramWidth,UpHistoGramColor);
   SetIndexStyle(1,DRAW_HISTOGRAM,DwHistoGramStyle,DwHistoGramWidth,DwHistoGramColor);
   SetIndexBuffer(2,FastMa);
   SetIndexStyle(2,DRAW_LINE,FastMaStyle,FastMaWidth,FastMaColor);
   SetIndexBuffer(3,SlowMa);
   SetIndexStyle(3,DRAW_LINE,SlowMaStyle,SlowMaWidth,SlowMaColor);
   SetIndexBuffer(4,MaDistanceInPoints);
   SetIndexStyle(4,DRAW_NONE,EMPTY,EMPTY,clrNONE);
   BarDeflekt=SlowMaPeriod;
   if(FastMaPeriod>BarDeflekt){BarDeflekt=FastMaPeriod;}
//---
   return(INIT_SUCCEEDED);
  }
//+------------------------------------------------------------------+
//| Custom indicator iteration function                              |
//+------------------------------------------------------------------+
int OnCalculate(const int rates_total,
                const int prev_calculated,
                const datetime &time[],
                const double &open[],
                const double &high[],
                const double &low[],
                const double &close[],
                const long &tick_volume[],
                const long &volume[],
                const int &spread[])
  {
//---
  int total=rates_total-prev_calculated;
  int toscan=rates_total-BarDeflekt-1;
  if(prev_calculated==rates_total){toscan=0;}
  if(rates_total>prev_calculated&&prev_calculated>0&&total==1){toscan=1;}
  for(int i=toscan;i>=0;i--)
  {
  FastMa[i]=iMA(_Symbol,_Period,FastMaPeriod,FastMaShift,FastMaMethod,FastMaPrice,i);
  SlowMa[i]=iMA(_Symbol,_Period,SlowMaPeriod,SlowMaShift,SlowMaMethod,SlowMaPrice,i);
  //histogram display
    if(FastMa[i]>=SlowMa[i]){HistaboveBuffer[i]=FastMa[i];HistobelowBuffer[i]=SlowMa[i];}
    if(FastMa[i]<SlowMa[i]){HistobelowBuffer[i]=SlowMa[i];HistaboveBuffer[i]=FastMa[i];}
  //distance export
    MaDistanceInPoints[i]=(FastMa[i]-SlowMa[i])/Point();
  }
//--- return value of prev_calculated for next call
   return(rates_total);
  }
So you want the difference of the 2 Ma's in points basically (programmatically) and the visuals with the histogram on the separate window like @Vladimir Karputov showed
Try This , it has no separate window ,you can access the distance of the ma's in points with buffer 4 (if you know how)
Thank you so much. i appropriate it.
- Free trading apps
- Over 8,000 signals for copying
- Economic news for exploring financial markets
You agree to website policy and terms of use
Hi Guys.
Has anyone come across a moving average histogram but with the added condition if price is above or below the moving average?