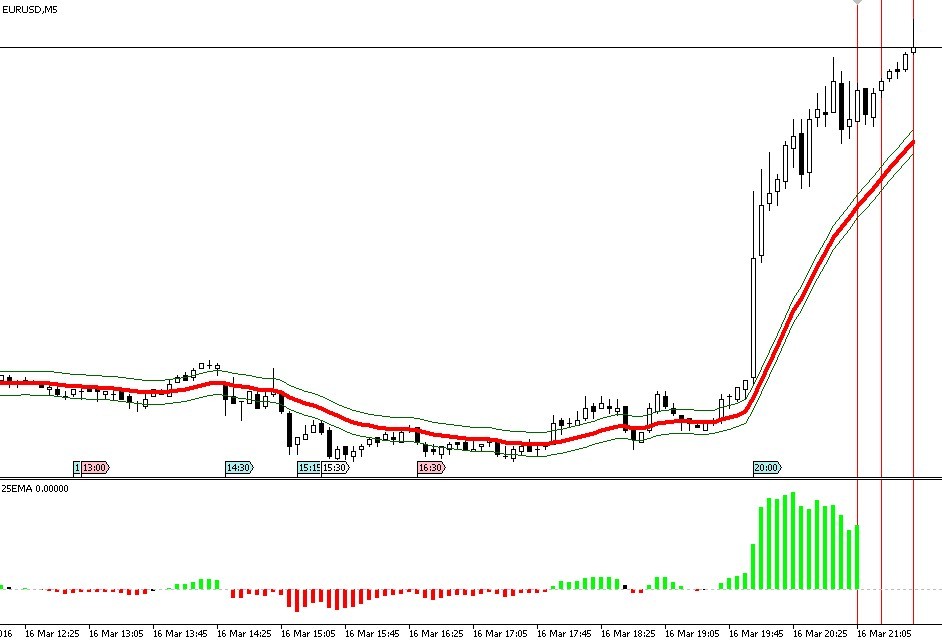
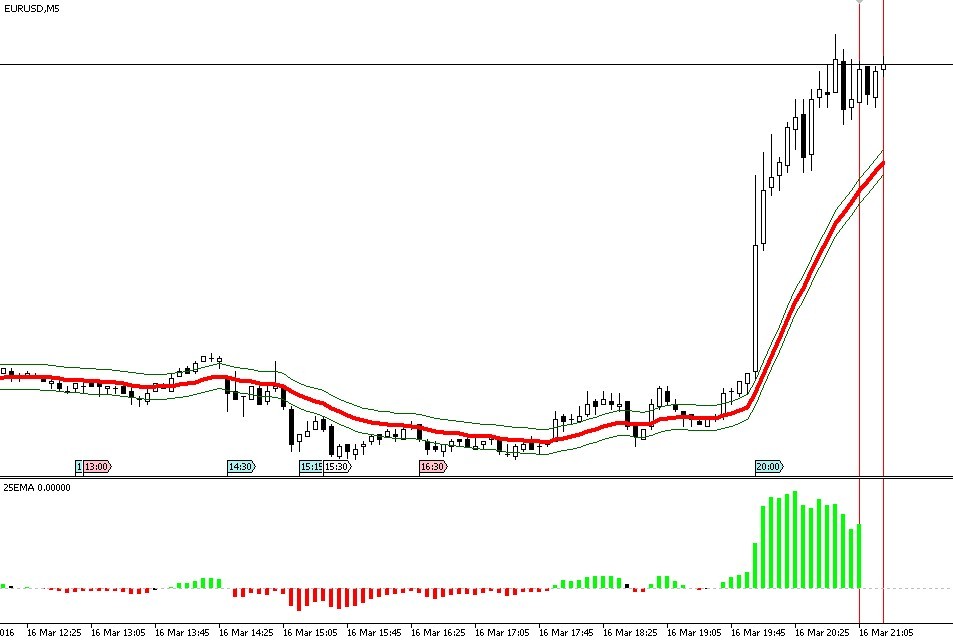
Indicators: FxTrend 25EMA
good indicator, but after a new bar appears, a new histogram line does not appear in the indicator window. you have to switch to another timeframe and back to the previous one to update the indicator window. Red lines are drawn for better visualisation. Dear author, fix the bug with the indicator!
Files:
25_ema_2.jpg
84 kb
25_ema.jpg
81 kb
I know that the indicator is from 2016 and we're in 2020, but I found a simple flaw, but I couldn't find a version with a fix.
The original code has the following line:
#property indicator_buffers 2
As the indicator has 3 buffers, not 2, it always shows an error when running. To adjust:
#property indicator_buffers 3
You are missing trading opportunities:
- Free trading apps
- Over 8,000 signals for copying
- Economic news for exploring financial markets
Registration
Log in
You agree to website policy and terms of use
If you do not have an account, please register
FxTrend 25EMA:
FxTrend 25EMA is based on the difference of the EMA 25 value during two different moments.
The FxTrend 25EMA value represent the momentum and the strength in the market. And the color represents the trend.
Author: Jose Luis Gongora Fernandez