AUDCAD Technical Analysis 2014
Hi mazennafee,
As I see - this is technical analysis for AUDCAD for 2014 (for whole the year)? Or for 1 week?
Because as I see the title of this thread: AUDCAD Technical Analysis 2014
no it is 4h time frame and it could continue from 1 week to 3 weeks
and it will be updated every new updates on chart view on 4htime frame
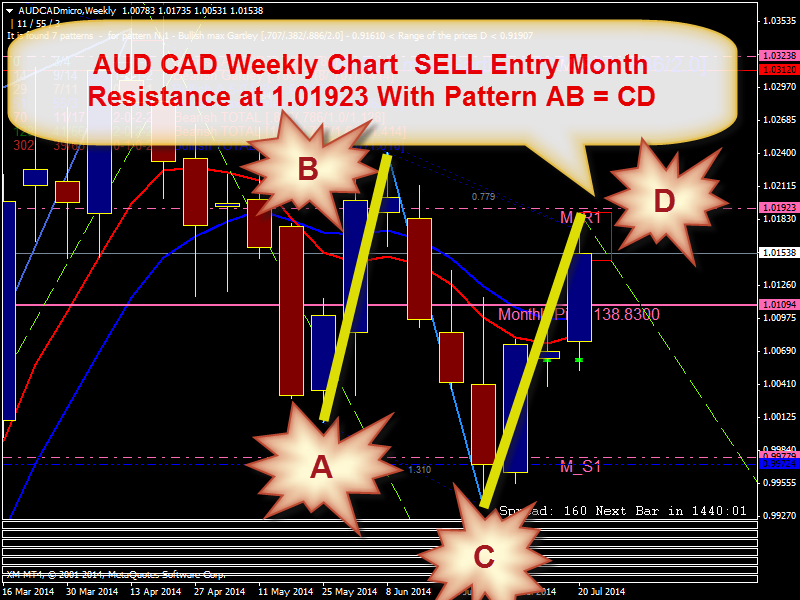
AUD CAD Weekly Chart SELL Entry Month Resistance at 1.01923 With Pattern AB = CD
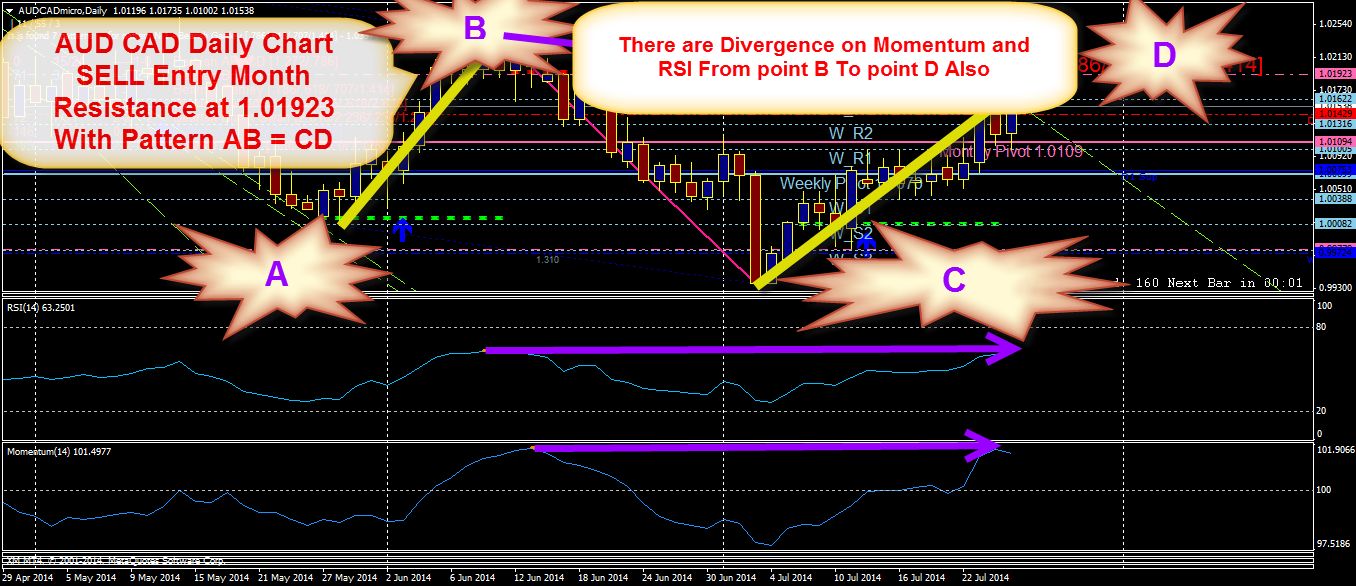
AUD CAD Daily Chart SELL Entry Month Resistance at 1.01923 With Pattern AB = CD With There are Divergence on Momentum and RSI From point B To point D Also
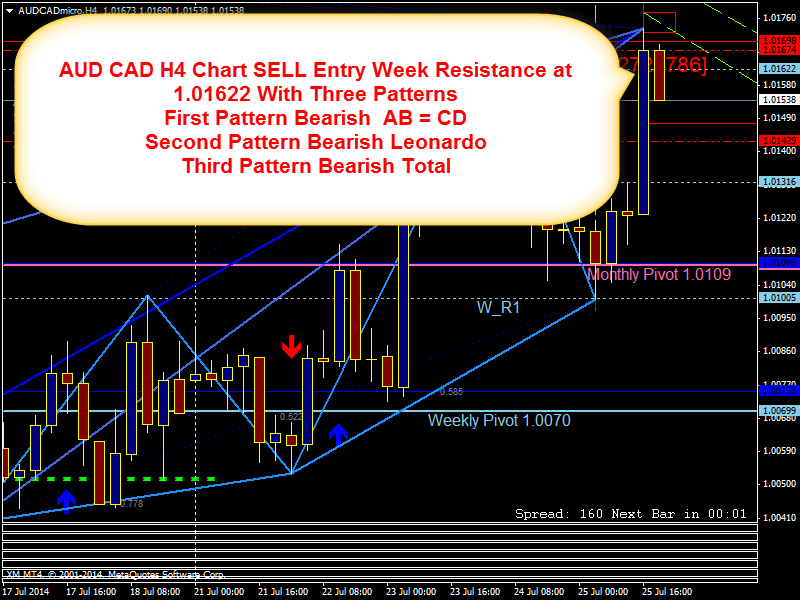
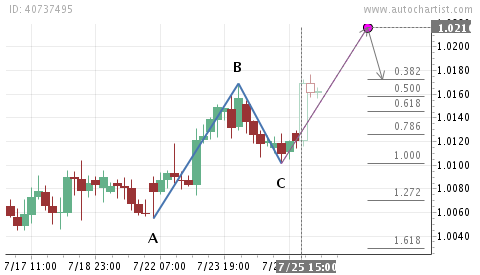
AUD CAD H4 Chart SELL Entry Week Resistance at 1.01622 With Three Patterns
First Pattern Bearish AB = CD
Second Pattern Bearish Leonardo
Third Pattern Bearish Total
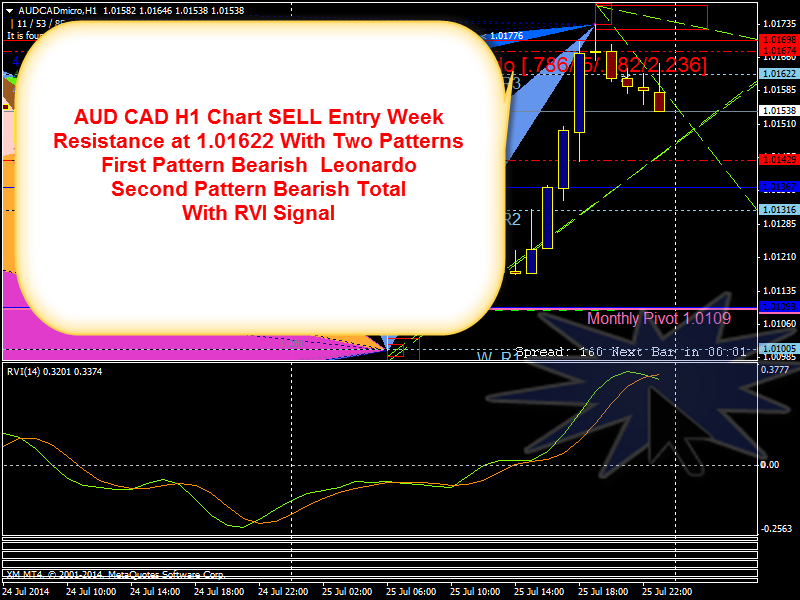
AUD CAD H1 Chart SELL Entry Week Resistance at 1.01622 With Two Patterns
First Pattern Bearish Leonardo
Second Pattern Bearish Total
With RVI Signal
Exchange | FOREX |
Symbol | |
Interval | 240 Min |
Pattern | ABCD |
Identified Time | 07-25 15:00 |
Length | 30 Candles |
Direction | |
Quality | |
Time Symmetry | |
Price Symmetry | |
Clarity | |
Target 0.382 | 1.0172 |
Target 0.500 | 1.0158 |
Target 0.618 | 1.0145 |
Target 0.786 | 1.0126 |
Target 1.000 | 1.0101 |
Target 1.272 | 1.0070 |
Target 1.618 | 1.0030 |
Exchange | FOREX |
Symbol | AUDCAD |
Interval | 240 Min |
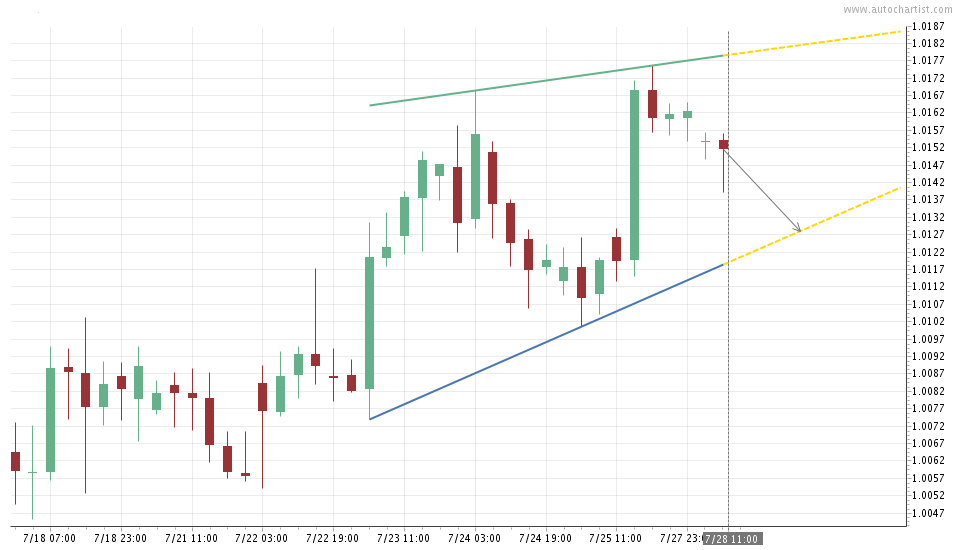
Pattern | Rising Wedge |
Identified Time | 07-28 11:00 |
Length | 20 Candles |
Direction | |
Trend Change | Continuation |
Quality | |
Initial Trend | |
Volume | N/A |
Uniformity | |
Clarity | |
Breakout | N/A |
Forecast Price | N/A |
You are missing trading opportunities:
- Free trading apps
- Over 8,000 signals for copying
- Economic news for exploring financial markets
Registration
Log in
You agree to website policy and terms of use
If you do not have an account, please register
there are divergence RSI(14) Momentum (14) ADX (14)
with month Resistance at 1.01927 And week Resistance at 1.01622
with AB=CD Pattren
Suggestion Below 1.02371 Sell