Margin Call Indicator
I am sort of new to this & am looking to subscribe to a signal. Which graph is the best indicator so I do not reach a margin call?
IE when I look at the signal statistics would it be the balance graph, draw down graph, equity graph, balance graph, etc?
Thanks in advance.
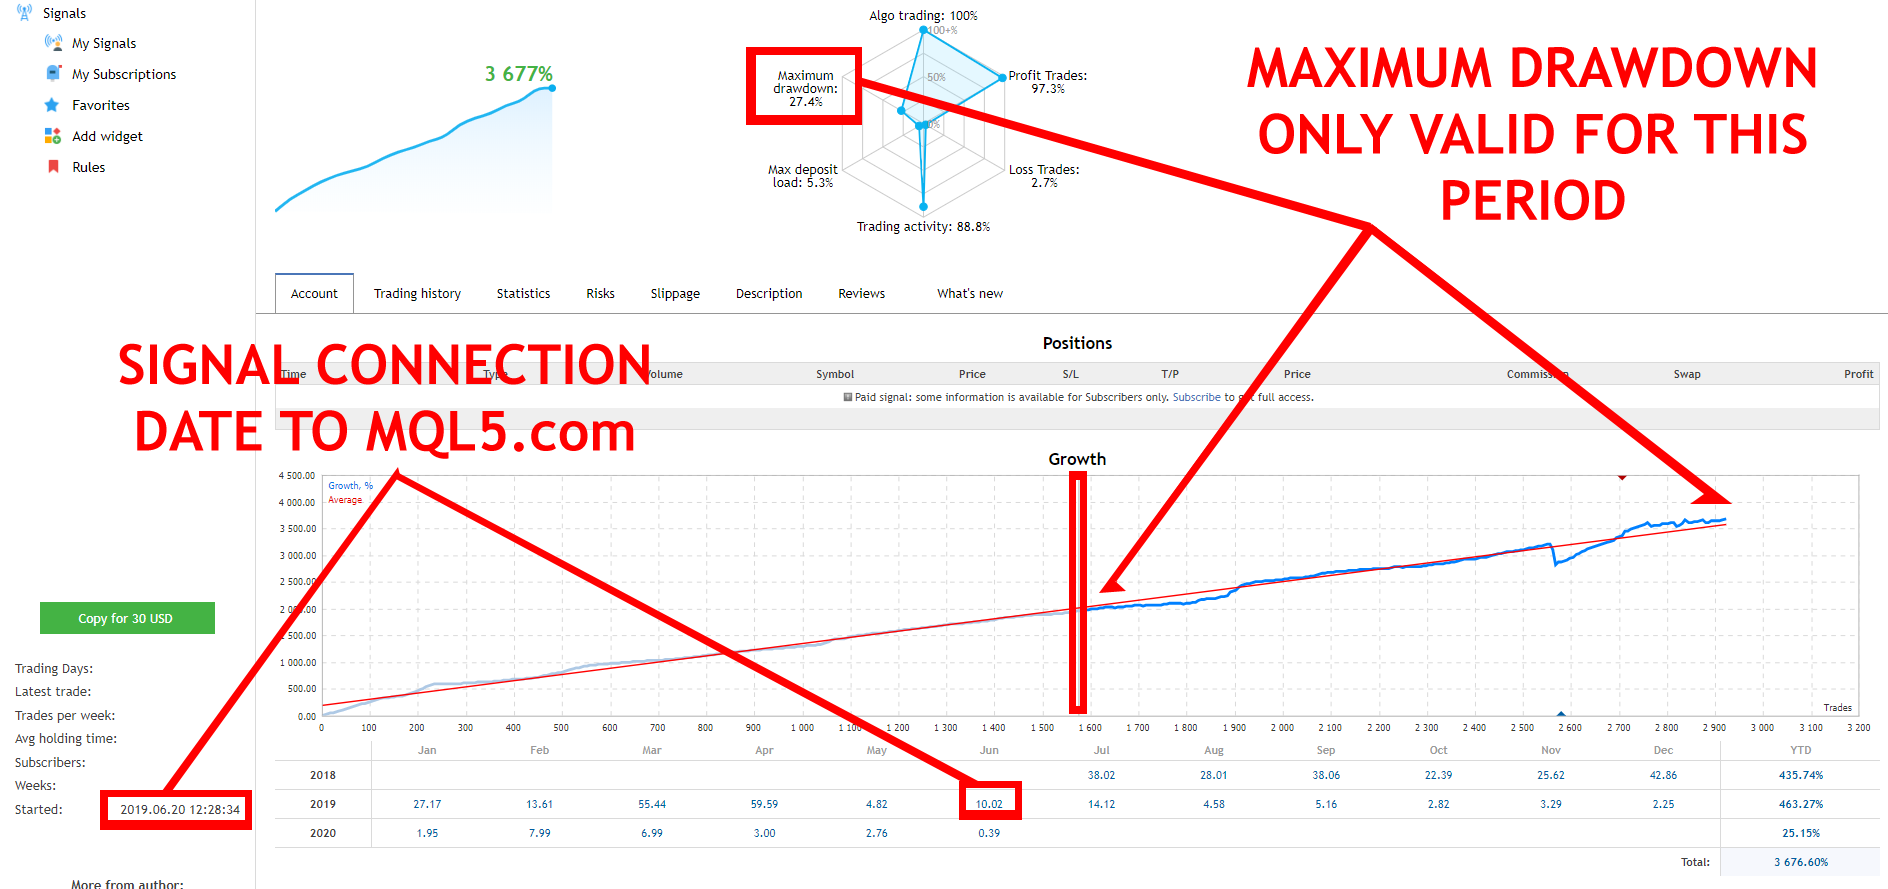
The most useful statistics are the growth chart in comparison with the maximum drawdown, as long as its genuine and not 'fake'.
In order for the maximum drawdown to be genuine, you need to check whether the growth chart consists of a dark blue line or has a light blue line for a large part of the signal's history.
Thank you. This was extremely helpful.
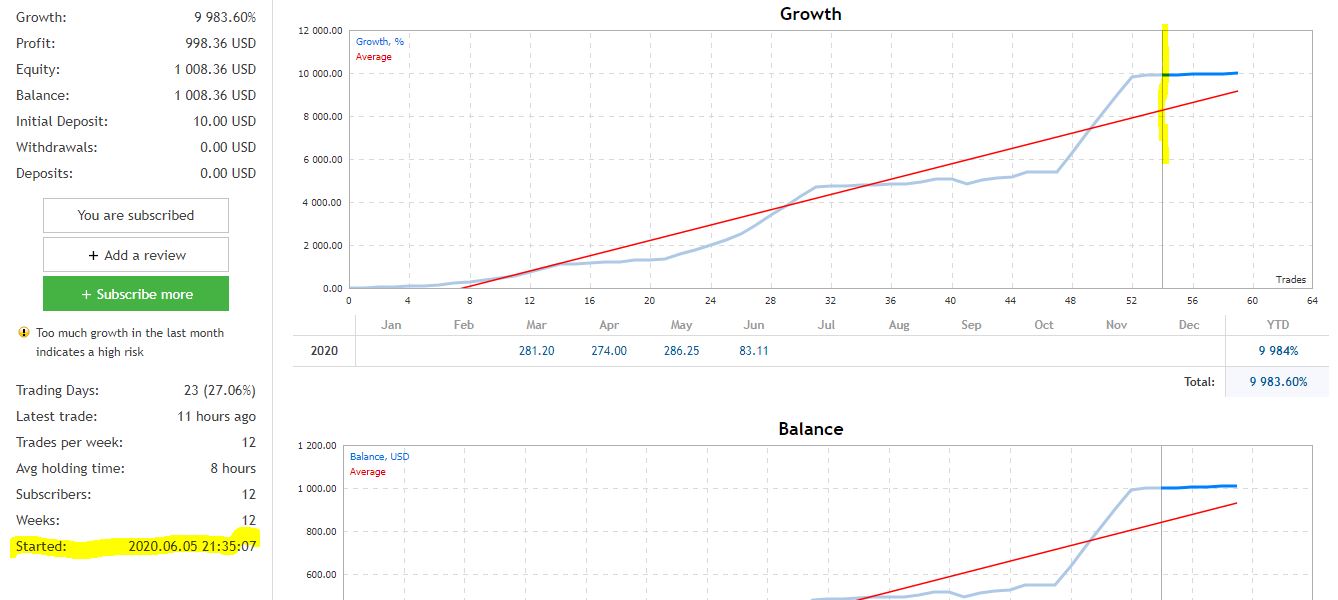
So in the attached image I see a dark blue line that then turns to a light blue line. In addition, in the bottom left hand corner is says 'Started: June 5th). Does that mean that the statistics (IE balance, draw down, equity, etc) started only from June 5th & not all trades for this signal?
It also says 'Trading Days: 23 (27.06%)'. What would that be referring to?
Thanks again!
Thank you. This was extremely helpful.
So in the attached image I see a dark blue line that then turns to a light blue line. In addition, in the bottom left hand corner is says 'Started: June 5th). Does that mean that the statistics (IE balance, draw down, equity, etc) started only from June 5th & not all trades for this signal?
It also says 'Trading Days: 23 (27.06%)'. What would that be referring to?
Thanks again!
There is a light blue line followed by a dark blue one, not the other way around. The light blue line is the non-connected period and the dark blue is the connected period.
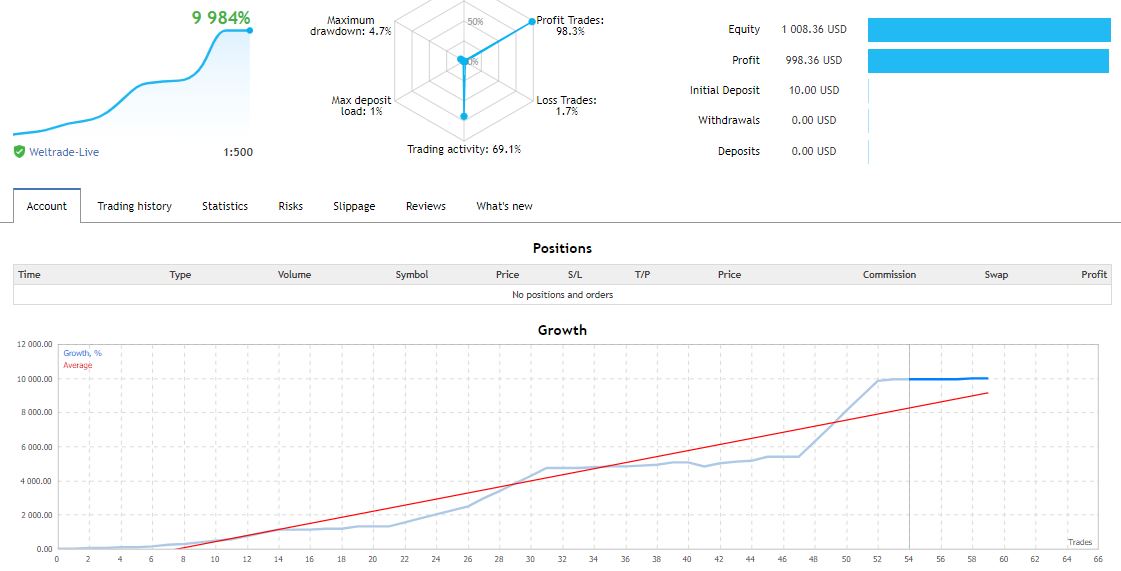
In most charts, you can see the starting point is the 5th of June, including the max drawdown.
In the above example the 4.7% max drawdown is only valid for the days after the 5th of June.
The 'trading days: 23 (27.06%)' means that the signal had open trades for the 27% of the entire signal's lifetime.
- Free trading apps
- Over 8,000 signals for copying
- Economic news for exploring financial markets
You agree to website policy and terms of use
I am sort of new to this & am looking to subscribe to a signal. Which graph is the best indicator so I do not reach a margin call?
IE when I look at the signal statistics would it be the balance graph, draw down graph, equity graph, balance graph, etc?
Thanks in advance.