Discussion of article "Econometric Approach to Analysis of Charts"
This is fundamentally wrong.
Firstly, let us speak in Russian and call "kurtosis" and "islandness" by the accepted term - kurtosis coefficient or simply kurtosis.
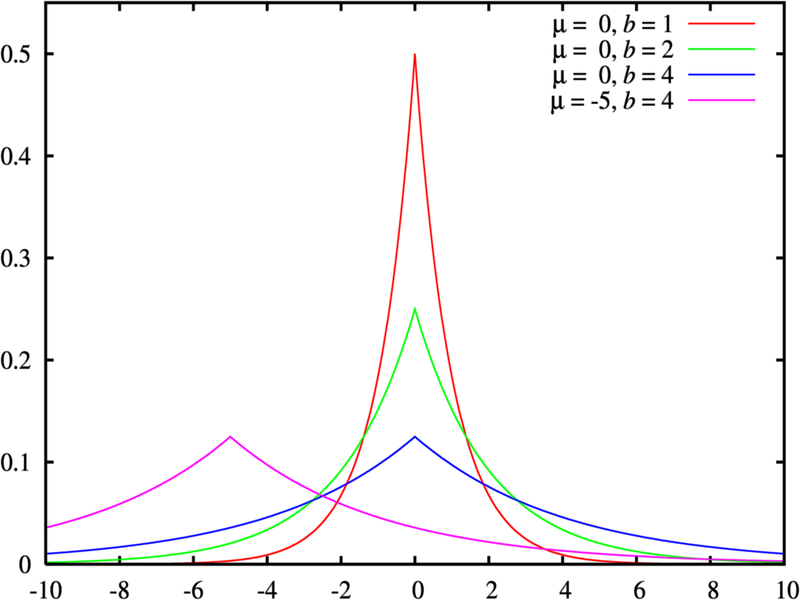
Secondly, "islandness" and "fat tails" in general case are not related in any way. Here is a counterexample - the Laplace distribution (bilateral exponential), to which, it should be said, the graphs of the vast majority of financial time series obey. Its excess is equal to 3 (i.e. its top is sharper than that of the normal distribution), but the tails are thick - they decrease according to the law exp(-x), i.e. slower than that of the Gaussian exp(-x^2).
It is fundamentally wrong.
Firstly, let us speak in Russian and call "kurtosis" and "islandness" by the accepted term - kurtosis coefficient or simply kurtosis.
Secondly, "islandness" and "fat tails" in general case are not related in any way. Here is a counterexample - the Laplace distribution (bilateral exponential), to which, it should be said, the graphs of the vast majority of financial time series obey. Its excess is equal to 3 (i.e. the top is sharper than in the normal distribution), but the tails are just thick - they decrease according to the law exp(-x), i.e. slower than in the Gaussian exp(-x^2).
Moreover, there is no concept of "Excess" per se, there is a concept of "Excess Ratio", which is a measure for another concept "Excess of Distribution", and this concept is defined only for unimodal distributions. Thus, in order to use this coefficient rightfully, it is necessary, firstly, to determine the empirical distribution function, which is not a trivial task from the point of view of mathematics, and secondly, within the framework of some probabilistic criteria, to check and accept the hypothesis that the distribution has a single mode, which is not always fulfilled for financial series and is also a nontrivial task. Without these steps further calculation is impossible, if it requires the "Excess coefficient".
P.S..
Nothing is written about what to do if the test says that the series is not applicable for the assumed model.
Nothing is said about why and on what basis a series of so-called "yields" and not some other one is used.
In practice, the main reason why working with asset returns is preferable to working with direct asset prices is that returns have more attractive statistical properties.
alsu:
...Let's speak Russian and call "kurtosis" and "islandness" by the accepted term - coefficient of excess or just excess....
I especially liked the fact that alsu considers the words "coefficient" and "excess" to be Russian...
alsu:
Secondly, "islandness" and "fat tails" are generally not related. Here is a counterexample - the Laplace distribution (bilateral exponential), to which, it should be noted, the graphs of the vast majority of financial time series obey. Its excess is equal to 3 (i.e. the top is sharper than in the normal distribution), but the tails are just thick - they decrease according to the law exp(-x), i.e. slower than in the Gaussian exp(-x^2).
That's exactly what I believe is generally related.
An example of "less kurtosis-thicker tails" is shown in Fig. "Laplace distributions with different parameters".
I would only add the following sentence to my article: "The distribution of a series of returns more often exhibits fat-tail behaviour than the normal distribution." The phenomenon of "fat tails" is called excess kurtosis in English-language literature. Those series whose distributions have such tails are called leptokurtic, having positive kurtosis (exceeding the kurtosis of the normal distribution).
Then about the kurtosis coefficient:
Thenormal distribution has zero kurtosis, γ2 = 0.
If the tails of the distribution are "lighter" and the peak is sharper than the normal distribution, then γ2 > 0.
If the tails of the distribution are "heavier" and the peak is more "flattened" than the normal distribution, then γ2 < 0.
I would only add such a suggestion to my article:
I would only add the following sentence to my article: "The distribution of a series of returns more often exhibits fat-tail behaviour than the normal distribution." The phenomenon of "fat tails" is called excess kurtosis in English-language literature. Those series whose distributions have such tails are called leptokurtic, having positive kurtosis (exceeding the kurtosis of the normal distribution).
Then about the kurtosis coefficient:
Thenormal distribution has zero kurtosis, γ2 = 0.
If the tails of the distribution are "lighter" and the peak is sharper than the normal distribution, then γ2 > 0.
If the tails of the distribution are "heavier" and the peak is more "flattened" than the normal distribution, then γ2 < 0.
While you are arguing about terms, I have overnight already built some profitable EAs using ideas from this article. :-)
However, their profits are very small, although they are quite stable (checked on the history of 12 years, the charts grow beautifully). The correlations detected by the methods described in the article are rather weak ( autocorrelation coefficients of the series are about 0.01, in exceptional cases approaching 0.1, depending on which price derivatives are correlated), and when trading the profit from them is strongly beaten by the spread. I had to add a filter to make trades only on arrival of strong signals, otherwise the profitability curve would go down quasi-straight.
Thanks to the author in any case. The ideas are valuable. I think that critics should not poke the author's nose into the abysses of matheory, but consider the article as an indication of a wide field for practical experiments.
While you are arguing about terms, I have overnight already built some profitable EAs using ideas from this article. :-)
However, their profits are very small, although they are quite stable (checked on the history of 12 years, the charts grow beautifully). The correlations detected by the methods described in the article are rather weak (autocorrelation coefficients of the series are about 0.01, in exceptional cases approaching 0.1, depending on which price derivatives are correlated), and when trading the profit from them is strongly beaten by the spread. I had to add a filter to make trades only on arrival of strong signals, otherwise the profitability curve would go down quasi-straight.
Thanks to the author in any case. The ideas are valuable. I think that critics should not poke the author's nose into the abysses of matheory, but consider the article as an indication of a wide field for practical experiments.
- Free trading apps
- Over 8,000 signals for copying
- Economic news for exploring financial markets
You agree to website policy and terms of use
New article Econometric Approach to Analysis of Charts is published:
This article describes the econometric methods of analysis, the autocorrelation analysis and the analysis of conditional variance in particular. What is the benefit of the approach described here? Use of the non-linear GARCH models allows representing the analyzed series formally from the mathematical point of view and creating a forecast for a specified number of steps.
Author: Dennis Kirichenko