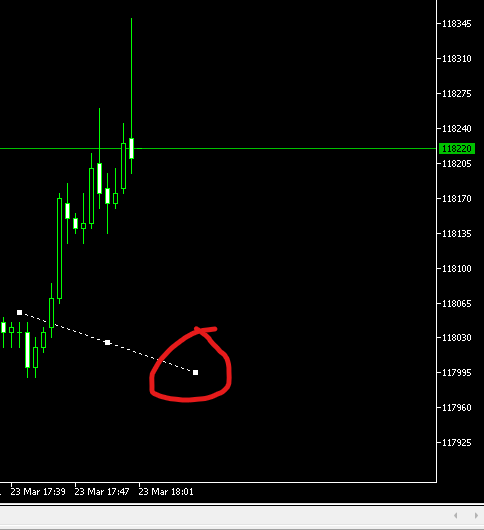
Hi,
I'm developing a system which includes drawing figures and, for that, I need to pick the angle between two selected points in the graph. To do that, I need to calculate the difference between the second point and the first one, something like
Everything was doing fine until I started to pick the second point from a different day in a intraday graph. In that case, the above subtraction don't actually give me the correct number of candles between point 1 and 2.
So how can I correctly get the exact number of candles in the current graph periodicity while having the datetime of the two points?
int  Bars(
   string           symbol_name,     // symbol name
   ENUM_TIMEFRAMES  timeframe,       // period
   datetime         start_time,      // start date and time
   datetime         stop_time        // end date and time
   );

- www.mql5.com
The difference between two datetimes will never give candle numbers. They give seconds. Dividing by PeriodSeconds()
assumes every bar every exists — they don't. What if there are no ticks during a specific candle period? There can be minutes between ticks during the
Asian session, think M1 chart. Larger charts, think weekend, market holiday (country and broker specific.) requires knowledge of when
your broker stops and starts (not necessary the same as the market.)
"Free-of-Holes"
Charts - MQL4 Articles
No
candle if open = close ? - MQL4 programming forum
Either Martin's suggestion, or for MT4/5 subtract iBarShift()
Thanks. Unfortunately, it didn't work. I substituted the call to this function whenever needed and I end up getting an unprecise draw. Nevertheless I suppose I may apply a correction using this function. So, thanks!
EDIT: Now I managed to correct the erroneous draw I mentioned above, but a new problem happened: whenever I click outside of the graph (i.e. 'in the future', where candles have not yet been drawn), which is necessary for my purposes, the Bars function returns a misleading candlestick count: it only counts till the last drawn candle.
"Free-of-Holes" Charts - MQL4 Articles
No candle if open = close ? - MQL4 programming forum
- Free trading apps
- Over 8,000 signals for copying
- Economic news for exploring financial markets
You agree to website policy and terms of use


I'm developing a system which includes drawing figures and, for that, I need to pick the angle between two selected points in the graph. To do that, I need to calculate the difference between the second point and the first one, something like
double(datetimeOfSecondPoint - datetimeOfFirstPoint)Everything was doing fine until I started to pick the second point from a different day in a intraday graph. In that case, the above subtraction don't actually give me the correct number of candles between point 1 and 2.
So how can I correctly get the exact number of candles in the current graph periodicity while having the datetime of the two points?