Indicators: volatility_Bar
Hello
Good indicator , but no output buffers , always zero
Hello
Good indicator , but no output buffers , always zero
SetIndexBuffer( 0 ,Trend1); Blue == 0.1
SetIndexBuffer( 1 ,Trend2); Lime == 0.1
SetIndexBuffer(2,Flat1); Red== -0.1
SetIndexBuffer( 3,Flat2); Yellow == -0.1
double Blue _ = iCustom(_Symbol,PERIOD_M5,"volatility_bar",bar,koef,level, 0 ,0);
double Lime _ = iCustom(_Symbol,PERIOD_M5,"volatility_bar",bar,koef,level, 1 ,0);
if(Blue _ == 0.1)
{
---/---
}
// or ----------------------------------+
if(Blue _ == 0.1||Lime _ == 0.1)
{
---/---
}
Hello,
Could you explain what is this filter:
double SP1(int i) {
double res =
0.363644232288*B1[i]
+0.319961361319*B1[i+1]
+0.2429021537279*B1[i+2]
+0.1499479402208*B1[i+3]
+0.0606476023757*B1[i+4]
-0.00876136797274*B1[i+5]
-0.0492967601969*B1[i+6]
-0.0606402244647*B1[i+7]
-0.0496978153976*B1[i+8]
-0.02724932305397*B1[i+9]
-0.00400372352396*B1[i+10]
+0.01244416185618*B1[i+11]
+0.01927941647120*B1[i+12]
+0.01821767237980*B1[i+13]
+0.01598780862402*B1[i+14]
-0.00338313465225*B1[i+15];
return(res);
}
Hi,
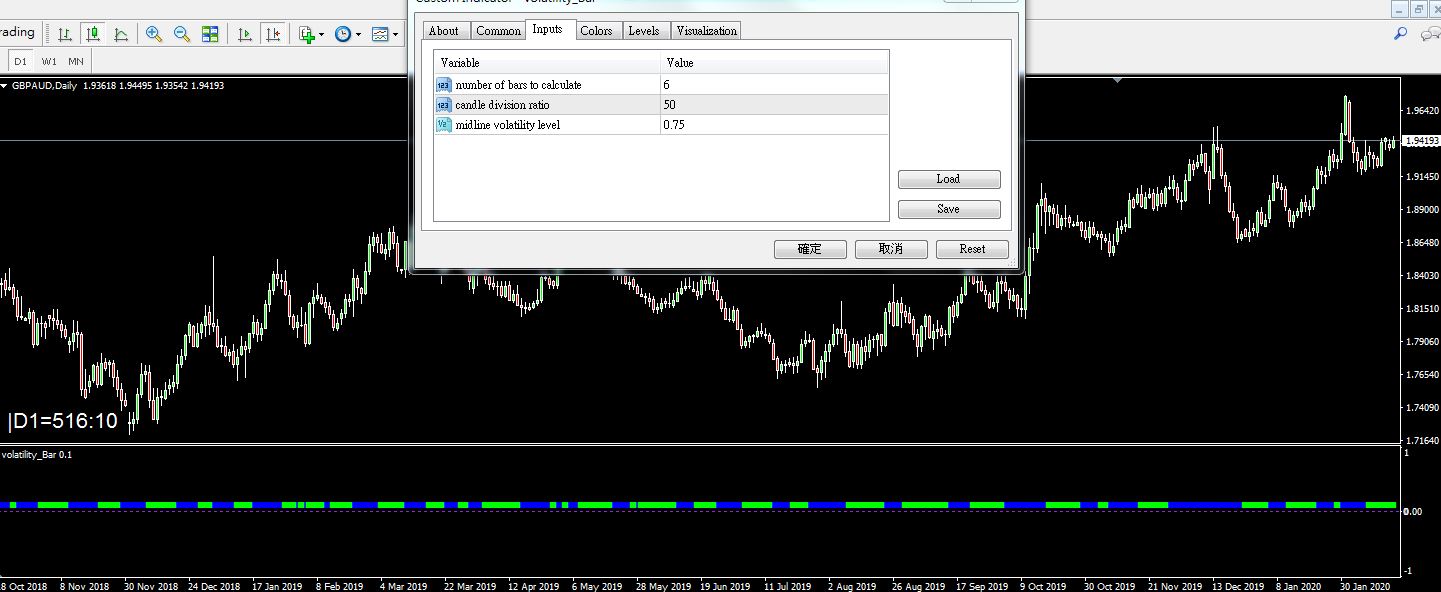
Yellow and Red buffer never shows up, the second and third parameter doesn't seems to change anything as well. Please see the attached picture, am I doing something wrong???
Hi,
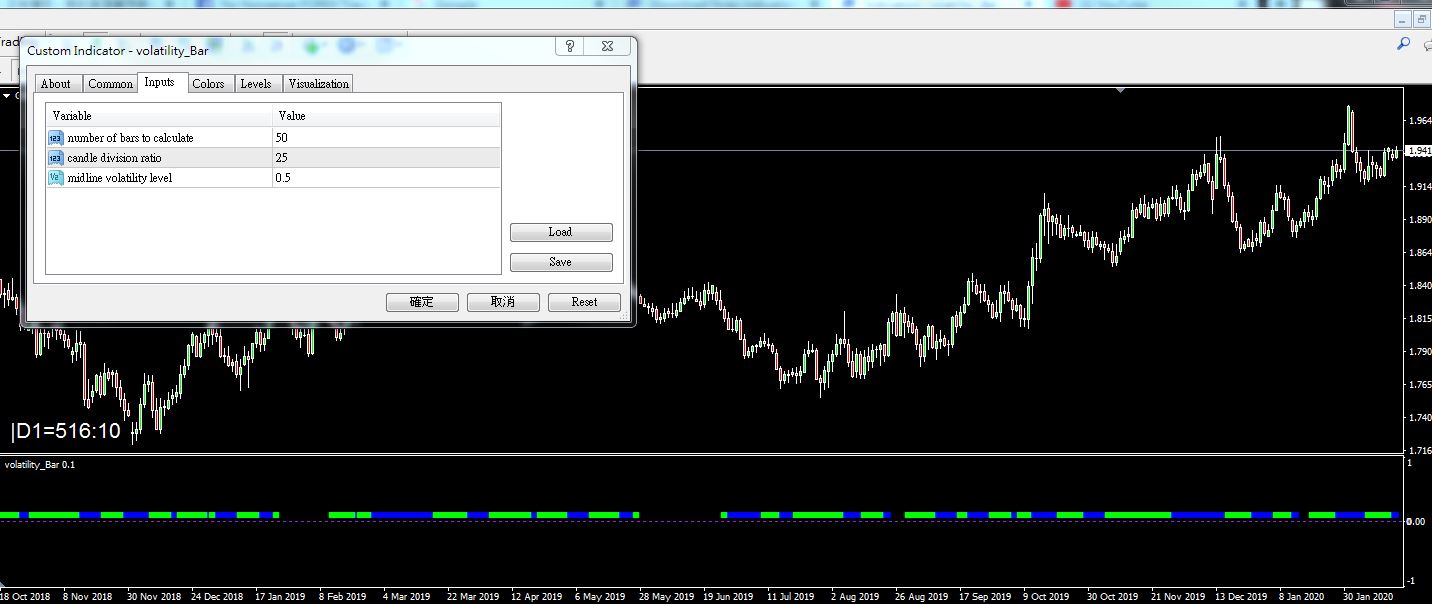
Yellow and Red buffer never shows up, the second and third parameter doesn't seems to change anything as well. Please see the attached picture, am I doing something wrong???
Try this version. the level on the daily chart will be above 5.21, you need to change the level.


Hello,
Could you explain what is this filter:
double SP1(int i) {
double res =
0.363644232288*B1[i]
+0.319961361319*B1[i+1]
+0.2429021537279*B1[i+2]
+0.1499479402208*B1[i+3]
+0.0606476023757*B1[i+4]
-0.00876136797274*B1[i+5]
-0.0492967601969*B1[i+6]
-0.0606402244647*B1[i+7]
-0.0496978153976*B1[i+8]
-0.02724932305397*B1[i+9]
-0.00400372352396*B1[i+10]
+0.01244416185618*B1[i+11]
+0.01927941647120*B1[i+12]
+0.01821767237980*B1[i+13]
+0.01598780862402*B1[i+14]
-0.00338313465225*B1[i+15];
return(res);
}

- www.mql5.com
- Free trading apps
- Over 8,000 signals for copying
- Economic news for exploring financial markets
You agree to website policy and terms of use
volatility_Bar:
volatility, flat
Author: Martingeil