Divide the chart into ten horizontal parts showing lines level
- Divide the chart into 10 horizontal equal parts
- Function that will delete horizontal lines in a specific chart.
- Create Two Horizontal Lines in the Current Chart
And what would be your starting point ?
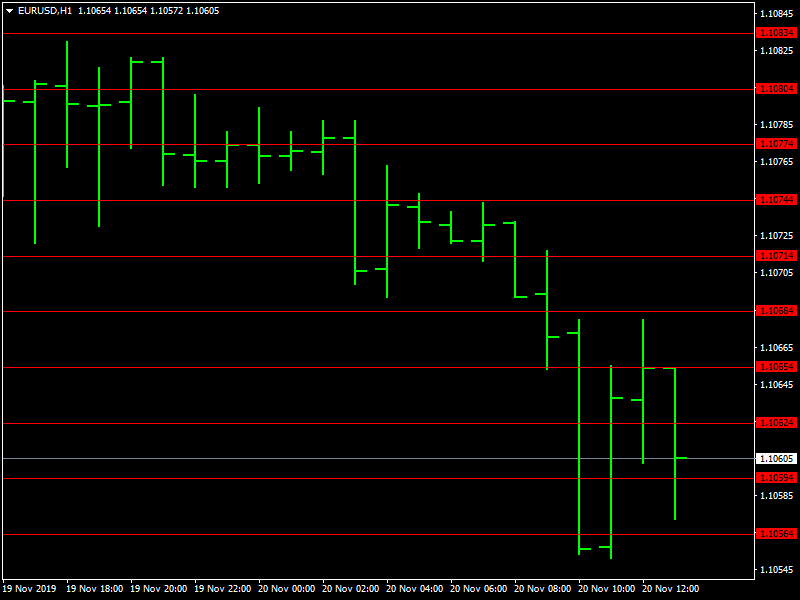
Here is a small example.
//+------------------------------------------------------------------+
//|                                                         Grid.mq4 |
//|                        Copyright 2019, MetaQuotes Software Corp. |
//|                                             https://www.mql5.com |
//+------------------------------------------------------------------+
#property copyright "Copyright 2019, MetaQuotes Software Corp."
#property link      "https://www.mql5.com"
#property version   "1.00"
#property strict
#property script_show_inputs
//--- input parameters
input int      depth=10;
input int      distance=30;
//+------------------------------------------------------------------+
//| Script program start function                                    |
//+------------------------------------------------------------------+
void OnStart()
  {
//---
   for(int i=1; i<depth; i++)
     {
      ObjectCreate(0,"Grid-High-"+IntegerToString(i),OBJ_HLINE,0,0,Open[0]+(i*distance)*Point);
      ObjectCreate(0,"Grid-Low-"+IntegerToString(i),OBJ_HLINE,0,0,Open[0]-(i*distance)*Point);
     }
  }
//+------------------------------------------------------------------+
And what would be your starting point ?
Here is a small example.
10%, 20% up to 90% from where from what where to start ?
The chart is dynamic it is always moving so it doesn't really make sense to divide that chart width or height.
You usually take a starting point like the daily open or the last highest high and etc.
10%, 20% up to 90% from where from what where to start ?
The chart is dynamic it is always moving so it doesn't really make sense to divide that chart width or height.
You usually take a starting point like the daily open or the last highest high and etc.
And what would be your starting point ?
Here is a small example.
Im so sorry sir, its too long to figure out the starting point. but as of now a realized that the starting point will be the highest point of the last 330 candles in the chart, also the lowest point will be the lowest point of the last 330 candles in the chart. God Bless you sir and thanks for the help.
- Free trading apps
- Over 8,000 signals for copying
- Economic news for exploring financial markets
You agree to website policy and terms of use