Changing The Coordinate Of A Moving Average
Hey guys, In this picture i have a 9 simple moving average in Red. I drew the blue line by hand. I want to to have something like the blue line.i mean how to change the algorithm of for example this moving average to gives me the blue line. I mean when market moves down, the line be below the price and when the market m oves up the line be above the price like that blue line. any suggestion for it? Thank you in advanced :)
This could be another moving average and its called moving averages crossover.
It won't be exactly like you drew it of course, but you can experiment with different moving averages of various settings in order to achieve the desired result.
Hi Eleni,
Maybe i couldnt get the concept right, the crossover doesnt matter for me. if you look at the red line you see when the market goes up the red line is below the price and when the market goes down the red line is above the price. i need a new calculation for this moving so that if the market goes up the line be above the price and when the market goes down the line be below the price.
Hey guys, In this picture i have a 9 simple moving average in Red. I drew the blue line by hand. I want to to have something like the blue line.i mean how to change the algorithm of for example this moving average to gives me the blue line. I mean when market moves down, the line be below the price and when the market m oves up the line be above the price like that blue line. any suggestion for it? Thank you in advanced :)
The easiest way i see is using open instead of close as the source of the line
Sure it needs some tunning, but candles mainly are up and down depending of the direction
I hope that's useful for you
The easiest way i see is using open instead of close as the source of the line
Sure it needs some tunning, but candles mainly are up and down depending of the direction
I hope that's useful for you
Hi Luis, thanks for reply. i tested it before it helps me but not as enough as i need. maybe i should add some pips to the open price.
Try adding another SMA with a period of 3 and use the "previous indicator's data" for the "Apply to:"
Perhaps this will do the trick since you are not concerned about the CROSSOVER.
Regards, Robert
PS. You will need to drag the MA onto the chart. :-)
Try adding another SMA with a period of 3 and use the "previous indicator's data" for the "Apply to:"
Perhaps this will do the trick since you are not concerned about the CROSSOVER.
Regards, Robert
PS. You will need to drag the MA onto the chart. :-)
Hi Robert, Thanks for your responding. I've seen this option before but my question is, this is a repainting option or not.But i have another
picture to everyone find out what i need. please take a look at the picture. Thank you :)
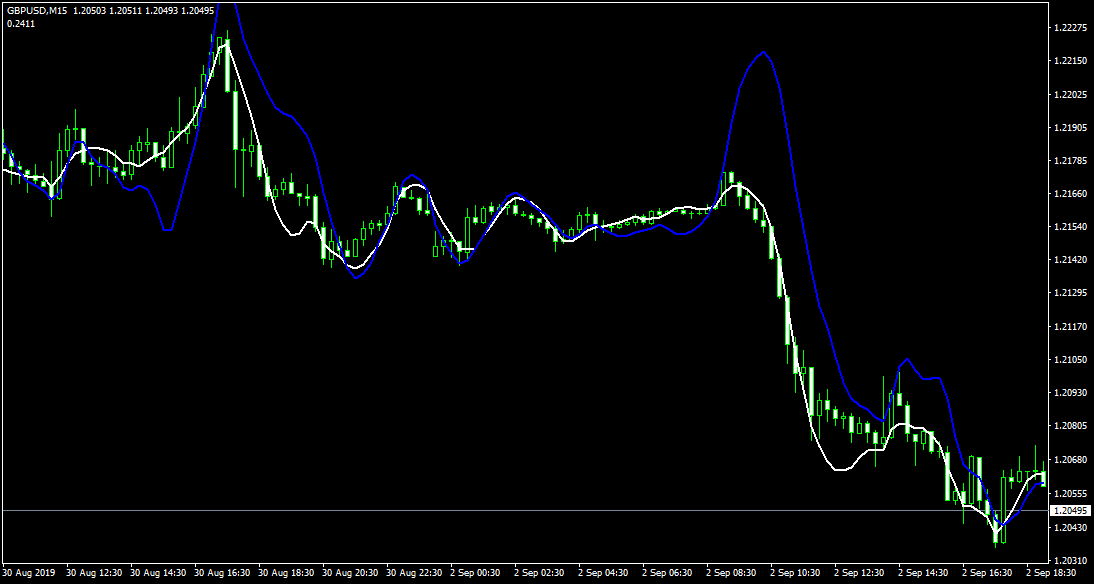
The blue line is something i want and the white line is something i have. the blue line repaints but if you look at it, the blue line is ahead of
white line. they are approximately the same but as you see, when the market goes down the blue line is above the price and white line is below the
price and ... . even the white line reacts sooner than blue line. i think find the algorithm of the blue line is more reasonable to
Regards :)
The blue line is something i want and the white line is something i have. the blue line repaints but if you look at it, the blue line is ahead of white line. they are approximately the same but as you see, when the market goes down the blue line is above the price and white line is below the price and ... i think its more reasonable.
Regards :)
You are asking for something ideal, that cannot be based anywhere technically.
- Free trading apps
- Over 8,000 signals for copying
- Economic news for exploring financial markets
You agree to website policy and terms of use
Hey guys, In this picture i have a 9 simple moving average in Red. I drew the blue line by hand. I want to to have something like the blue line.i mean how to change the algorithm of for example this moving average to gives me the blue line. I mean when market moves down, the line be below the price and when the market m oves up the line be above the price like that blue line. any suggestion for it? Thank you in advanced :)