Script search!
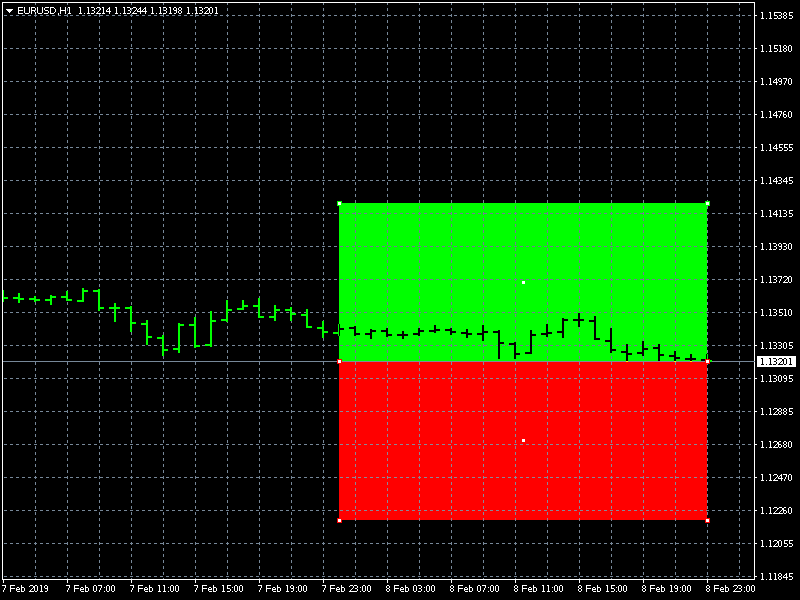
Long or short position, the neutral line indicates the price of entry, the price in red the SL and in green the TP.

They offer a few more options.

This simplifies the setting up of an order, but the most basic use remains only for the entry price and the SL.
Like this ?
Here is a script you can modify to suit your needs.
//+------------------------------------------------------------------+
//|                                                   Viewfinder.mq4 |
//|      Copyright 2018, Marco vd Heijden, MetaQuotes Software Corp. |
//|                                             https://www.mql5.com |
//+------------------------------------------------------------------+
#property copyright "Copyright 2018, Marco vd Heijden, MetaQuotes Software Corp."
#property link      "https://www.mql5.com"
#property version   "1.00"
#property strict
#property script_show_inputs
//--- input parameters
input int      Risk=1000;
//+------------------------------------------------------------------+
//| Script program start function                                    |
//+------------------------------------------------------------------+
void OnStart()
  {
//---
   ObjectDelete(0,"up");ObjectDelete(0,"dwn");
   RectangleCreate(0,"up",0,iTime(Symbol(),PERIOD_D1,0),Bid,TimeCurrent(),Bid+Risk*Point(),clrLime);
   RectangleCreate(0,"dwn",0,iTime(Symbol(),PERIOD_D1,0),Bid,TimeCurrent(),Bid-Risk*Point(),clrRed);
  }
//+------------------------------------------------------------------+
//| Create rectangle by the given coordinates                        |
//+------------------------------------------------------------------+
bool RectangleCreate(const long            chart_ID=0,        // chart's ID
                     const string          name="Rectangle",  // rectangle name
                     const int             sub_window=0,      // subwindow index
                     datetime              time1=0,           // first point time
                     double                price1=0,          // first point price
                     datetime              time2=0,           // second point time
                     double                price2=0,          // second point price
                     const color           clr=clrRed,        // rectangle color
                     const ENUM_LINE_STYLE style=STYLE_SOLID, // style of rectangle lines
                     const int             width=1,           // width of rectangle lines
                     const bool            fill=true,        // filling rectangle with color
                     const bool            back=false,        // in the background
                     const bool            selection=true,    // highlight to move
                     const bool            hidden=true,       // hidden in the object list
                     const long            z_order=0)         // priority for mouse click
  {
//--- set anchor points' coordinates if they are not set
   ChangeRectangleEmptyPoints(time1,price1,time2,price2);
//--- reset the error value
   ResetLastError();
//--- create a rectangle by the given coordinates
   if(!ObjectCreate(chart_ID,name,OBJ_RECTANGLE,sub_window,time1,price1,time2,price2))
     {
      Print(__FUNCTION__,
            ": failed to create a rectangle! Error code = ",GetLastError());
      return(false);
     }
//--- set rectangle color
   ObjectSetInteger(chart_ID,name,OBJPROP_COLOR,clr);
//--- set the style of rectangle lines
   ObjectSetInteger(chart_ID,name,OBJPROP_STYLE,style);
//--- set width of the rectangle lines
   ObjectSetInteger(chart_ID,name,OBJPROP_WIDTH,width);
//--- enable (true) or disable (false) the mode of filling the rectangle
   ObjectSetInteger(chart_ID,name,OBJPROP_FILL,fill);
//--- display in the foreground (false) or background (true)
   ObjectSetInteger(chart_ID,name,OBJPROP_BACK,back);
//--- enable (true) or disable (false) the mode of highlighting the rectangle for moving
//--- when creating a graphical object using ObjectCreate function, the object cannot be
//--- highlighted and moved by default. Inside this method, selection parameter
//--- is true by default making it possible to highlight and move the object
   ObjectSetInteger(chart_ID,name,OBJPROP_SELECTABLE,selection);
   ObjectSetInteger(chart_ID,name,OBJPROP_SELECTED,selection);
//--- hide (true) or display (false) graphical object name in the object list
   ObjectSetInteger(chart_ID,name,OBJPROP_HIDDEN,hidden);
//--- set the priority for receiving the event of a mouse click in the chart
   ObjectSetInteger(chart_ID,name,OBJPROP_ZORDER,z_order);
//--- successful execution
   return(true);
  }
//+------------------------------------------------------------------+
//| Move the rectangle anchor point                                  |
//+------------------------------------------------------------------+
bool RectanglePointChange(const long   chart_ID=0,       // chart's ID
                          const string name="Rectangle", // rectangle name
                          const int    point_index=0,    // anchor point index
                          datetime     time=0,           // anchor point time coordinate
                          double       price=0)          // anchor point price coordinate
  {
//--- if point position is not set, move it to the current bar having Bid price
   if(!time)
      time=TimeCurrent();
   if(!price)
      price=SymbolInfoDouble(Symbol(),SYMBOL_BID);
//--- reset the error value
   ResetLastError();
//--- move the anchor point
   if(!ObjectMove(chart_ID,name,point_index,time,price))
     {
      Print(__FUNCTION__,
            ": failed to move the anchor point! Error code = ",GetLastError());
      return(false);
     }
//--- successful execution
   return(true);
  }
//+------------------------------------------------------------------+
//| Delete the rectangle                                             |
//+------------------------------------------------------------------+
bool RectangleDelete(const long   chart_ID=0,       // chart's ID
                     const string name="Rectangle") // rectangle name
  {
//--- reset the error value
   ResetLastError();
//--- delete rectangle
   if(!ObjectDelete(chart_ID,name))
     {
      Print(__FUNCTION__,
            ": failed to delete rectangle! Error code = ",GetLastError());
      return(false);
     }
//--- successful execution
   return(true);
  }
//+------------------------------------------------------------------+
//| Check the values of rectangle's anchor points and set default    |
//| values for empty ones                                            |
//+------------------------------------------------------------------+
void ChangeRectangleEmptyPoints(datetime &time1,double &price1,
                                datetime &time2,double &price2)
  {
//--- if the first point's time is not set, it will be on the current bar
   if(!time1)
      time1=TimeCurrent();
//--- if the first point's price is not set, it will have Bid value
   if(!price1)
      price1=SymbolInfoDouble(Symbol(),SYMBOL_BID);
//--- if the second point's time is not set, it is located 9 bars left from the second one
   if(!time2)
     {
      //--- array for receiving the open time of the last 10 bars
      datetime temp[10];
      CopyTime(Symbol(),Period(),time1,10,temp);
      //--- set the second point 9 bars left from the first one
      time2=temp[0];
     }
//--- if the second point's price is not set, move it 300 points lower than the first one
   if(!price2)
      price2=price1-300*SymbolInfoDouble(Symbol(),SYMBOL_POINT);
  }
//+------------------------------------------------------------------+
wau.. could they create it?? I add the code without any problem, it doesn't throw any error. But nothing appears on the graph. Can it be created so that when we press the R key the RISK box is generated??? then we can open several on the chart, so that they are rectangles, not just 1 indicator.
search everywhere, try to generate the indicator with chatgpt and i can't do it. create many indicators for tradingview. but nevertheless for mt5 or mt4 I can't create a single one and it frustrates me. I only seek to generate the box. because I saw many risk box options, but they are for opening operations or calculating the risk. I only want the union of 2 rectangles together to be able to add it to the graph in a simple way.
I saw another person who could do it by putting 3 trend lines together parallel to each other. what he did was paint the interior with colors and it had also turned out very well. But I can't find a way to download them. many indicators disappeared from the market. I don't know if metatrader is a very old platform or what the problem is.- Free trading apps
- Over 8,000 signals for copying
- Economic news for exploring financial markets
You agree to website policy and terms of use
Hello everyone, I'm looking for a script that would allow me to do as tradingview for set my orders, there is a lot of script on the site and I can not find.