Using iHighest and iLowest to plot a variable - problem is resolved


A thanks to Marco vd Heijden whose comments showed that I was going in the wrong direction.

I am trying to apply high and highest as well as low and lowest to a Bollinger Bandwidth indicator. I am new to MT4 programing. Code was copied from a BBW indicator. Then High(...Highest(...)) and Low(...Lowest(...)) was added from Donchian channels. This is where the programming stopped because the functions refer to price and not to indicator values. Code indentation is increased or decreased to show the added lines. The 2 problem lines are near the bottom with ????? where values should be placed.
Thank You for the help
Bob

//+-------------------------------------------------------------------+
//|                                                    Bandswidth.mq4 |
//|                                         by Linuxser for Forex TSD |
//|                                                                   |
//| John Bollinger original formula is:                               |
//| (Upper BB - Lower BB)/middle BB                                   |
//| Copyright and link shows source of original Code                  |
//| The Code will not compile because lines 69 & 70 are incorrect     |
//| The code gives incorrect results when mode enums are used         |
//+-------------------------------------------------------------------+
#property copyright "Copyright © 2004, MetaQuotes Software Corp."
#property link      "http://www.metaquotes.net/"

#property indicator_separate_window
    #property indicator_buffers 3        //changed from 1 to 3
//all 3 bands are the same color
#property indicator_color1 Red
    #property indicator_color2 Red
    #property indicator_color2 Red

//---- input parameters
extern int BBPeriod=20;
extern int StdDeviation=2;
    extern int HiLoPeriod=120;          //number of bars for highest & lowest plots

//---- buffers
double BLGBuffer[];      //band width
    double HiBuffer[];   //band high
    double LoBuffer[];   //band low
//+------------------------------------------------------------------+
//| Custom indicator initialization function                         |
//+------------------------------------------------------------------+
int init()
  {
   string short_name;
//---- indicator line
   SetIndexStyle(0,DRAW_LINE);
   SetIndexBuffer(0,BLGBuffer);
SetIndexStyle(1,DRAW_LINE);
SetIndexBuffer(1,HiBuffer);
SetIndexStyle(2,DRAW_LINE);
SetIndexBuffer(2,LoBuffer);
//---- name for DataWindow and indicator subwindow label
   short_name="Bandswidth("+BBPeriod+","+StdDeviation+")";
   IndicatorShortName(short_name);
   SetIndexLabel(0,short_name);
//----
   SetIndexDrawBegin(0,BBPeriod);
SetIndexDrawBegin(1,BBPeriod);
SetIndexDrawBegin(2,BBPeriod);
//----
   return(0);
  }
//+------------------------------------------------------------------+
//| Momentum                                                         |
//+------------------------------------------------------------------+
int start()
  {
   int i,counted_bars=IndicatorCounted();
//----
   if(Bars<=BBPeriod) return(0);
//---- initial zero
   if(counted_bars<1)
      for(i=1;i<=BBPeriod;i++) BLGBuffer[Bars-i]=0.0;
//----
   i=Bars-BBPeriod-1;
   if(counted_bars>=BBPeriod) i=Bars-counted_bars-1;
   while(i>=0)
     {
      BLGBuffer[i]= (iBands(NULL,0,BBPeriod,StdDeviation,0,PRICE_CLOSE,MODE_UPPER,i) - iBands(NULL,0,BBPeriod,StdDeviation,0,PRICE_CLOSE,MODE_LOWER,i))
      /iMA(NULL,0,BBPeriod,0,MODE_SMA,PRICE_CLOSE,i);
      
HiBuffer[i]=iHigh(Symbol(),Period(),iHighest(Symbol(),Period(),?????,HiLoPeriod,i));
LoBuffer[i]=iLow(Symbol(),Period(),iLowest(Symbol(),Period(),?????,HiLoPeriod,i));
/*
these 2 lines were copied form Donchian channels
      upper[i]=iHigh(Symbol(),Period(),iHighest(Symbol(),Period(),MODE_HIGH,BarsToCount,i));
      lower[i]=iLow(Symbol(),Period(),iLowest(Symbol(),Period(),MODE_LOW,BarsToCount,i));
*/
      i--;
     }
   return(0);
  }
//+------------------------------------------------------------------+
MetaQuotes Software Corp.
  • www.metaquotes.net
Millions of traders and hundreds of brokers cannot be wrong — they have chosen MetaTrader 5 for trading Forex and financial markets! Learn more
 

ENUM_SERIESMODE

Identifier

Description

MODE_OPEN

Opening price

MODE_LOW

Low price

MODE_HIGH

High price

MODE_CLOSE

Close price

MODE_VOLUME

Tick volume

MODE_REAL_VOLUME

Real volume

MODE_SPREAD

Spread

 
Marco vd Heijden:

ENUM_SERIESMODE

Identifier

Description

MODE_OPEN

Opening price

MODE_LOW

Low price

MODE_HIGH

High price

MODE_CLOSE

Close price

MODE_VOLUME

Tick volume

MODE_REAL_VOLUME

Real volume

MODE_SPREAD

Spread

Thank You for the comment. The ENUM_SEROESMODE returns a price. The plot needs to be based on the indicator value, (upper band - lower band)/middle band.
 
iHighest
Returns the index of the highest value found on the corresponding chart (shift relative to the current bar).

int  iHighest( 
   const string        symbol,              // Symbol 
   ENUM_TIMEFRAMES     timeframe,           // Period 
   ENUM_SERIESMODE     type,                // Timeseries identifier 
   int                 count=WHOLE_ARRAY,   // Number of elements 
   int                 start=0              // Index 
  );
HiBuffer[i]=iHigh(Symbol(),Period(),iHighest(Symbol(),Period(),?????,HiLoPeriod,i));
LoBuffer[i]=iLow(Symbol(),Period(),iLowest(Symbol(),Period(),?????,HiLoPeriod,i));

What is your question ?

double  iBands(
   string       symbol,           // symbol
   int          timeframe,        // timeframe
   int          period,           // averaging period
   double       deviation,        // standard deviations
   int          bands_shift,      // bands shift
   int          applied_price,    // applied price
   int          mode,             // line index
   int          shift             // shift
   );
iBands(NULL,0,20,2,0,PRICE_LOW,MODE_LOWER,0)

Indicator line identifiers used in iBands(), iEnvelopes(), iEnvelopesOnArray(), iFractals() and iGator() indicators.

ID

Value

Description

MODE_UPPER

1

Upper line

MODE_LOWER

2

Lower line

iBands - Technical Indicators - MQL4 Reference
  • docs.mql4.com
iBands - Technical Indicators - MQL4 Reference
 

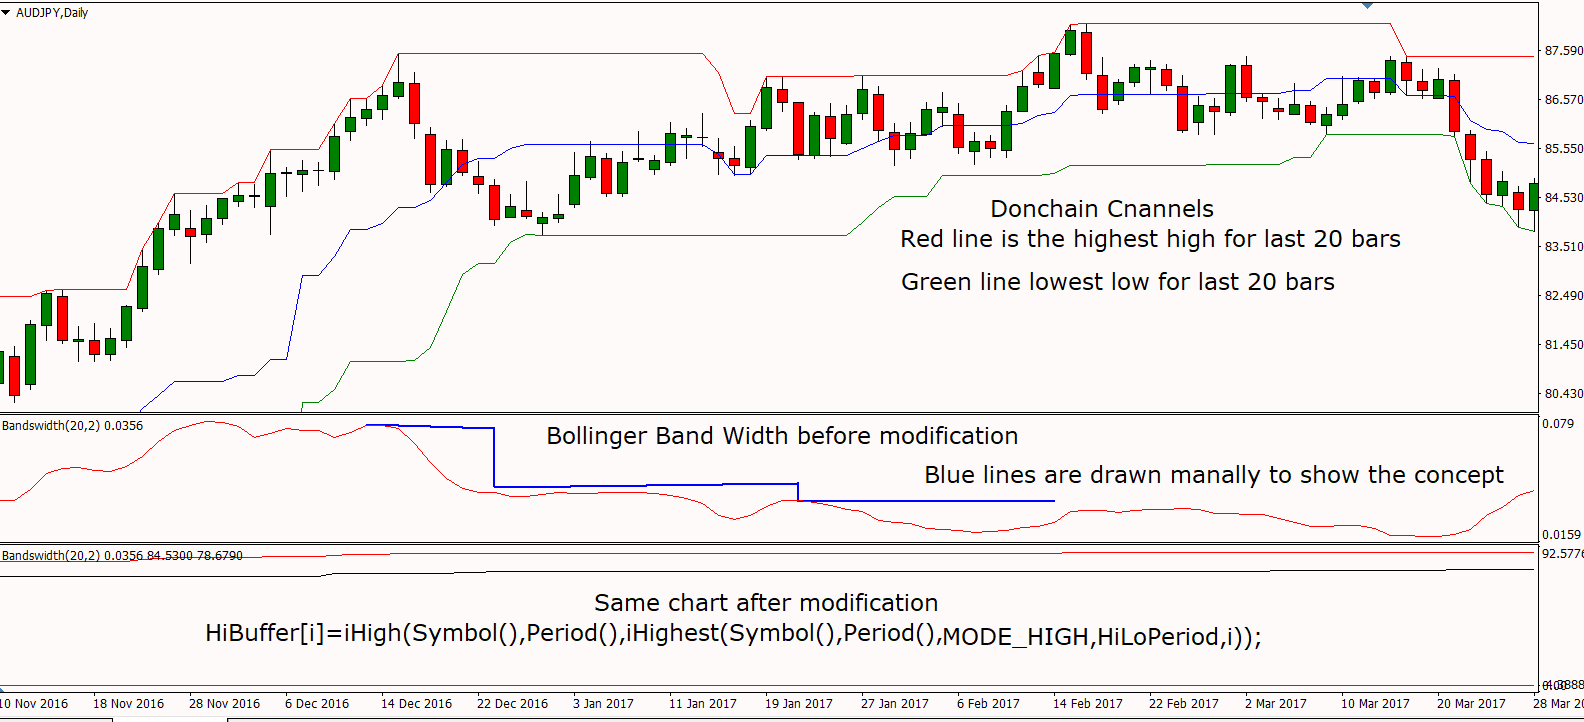
The main window shows Donchain Channels which plots highest price and lowest price for a given number of bars. I am trying to apply this concept to the BBW calculation which produces a percentage that is closer to a number of pips  than the price. plotting the high and low for 6 to 12 months shows current volatility to past volatility. Apparently I have gone in the wrong direction in trying to apply iHighest and iLowest functions. I have reviewed dozens of variations of this indicator that applied MAs, regression, fibs and Bollinger Bands. Maybe this can not be plotted.

  The main window has Donchian channels which illustrate what I would like to achieve. The first sub window is the indicator without modification. The blue lines were added to show what the modified indicator would look like. The second sub window is with the iHighest and iLowest functions