RSI Trend lines drawing problem !


Hello,

Im having some trouble building trend lines around a RSI indicator - what seems to be the problem is the "time" coordinate for setting  lines. The result is :


This is the first time i build such indicator !

Hope you can help ! The code is below :

   int limit;
   int counted_bars=IndicatorCounted();

   datetime time1,time2;
   double point1,point2;

   if(counted_bars>0) counted_bars--;
   limit=Bars-counted_bars;
   for(int i=1; i<limit; i++)
     {
      ExtRsiBuffer[i]=iRSI(NULL,0,RsiPeriod,PRICE_TYPICAL,i);
      double highest=ExtRsiBuffer[ArrayMaximum(ExtRsiBuffer,rsiDirectionPeriod,i)];
      double lowest=ExtRsiBuffer[ArrayMinimum(ExtRsiBuffer,rsiDirectionPeriod,i)];
      //----------------------------------------------------------------------------------------------------+
      double period_difference;
      int index,second_index,extremum_array_duration;
      if(i+rsiDirectionPeriod-1>=limit-1)
        {
         index=limit-1;
        }
      else
        {
         index=i+rsiDirectionPeriod-1;
        }
      //================================================  
      if(i>=limit-round(rsiDirectionPeriod/2))
        {
         extremum_array_duration=limit-1-i;
        }
      else
         extremum_array_duration=round(rsiDirectionPeriod/2);
      //--------------------------------------------------  
      if(i+extremum_array_duration>=limit-1-extremum_array_duration)
        {
         second_index=limit-1-extremum_array_duration;
        }
      else
         second_index=i+extremum_array_duration;
      //----------------------------------------------
      //-----------------------------------------------------------------------------------------------------+
      //============================
      int first_max=ArrayMaximum(ExtRsiBuffer,extremum_array_duration,second_index);
      int second_max=ArrayMaximum(ExtRsiBuffer,extremum_array_duration,i);
      //---
      int first_min=ArrayMinimum(ExtRsiBuffer,extremum_array_duration,second_index);
      int second_min=ArrayMinimum(ExtRsiBuffer,extremum_array_duration,i);
      //============================

      //=====
      if(last_point==1 || i>last_point)
        {
         period_difference=ExtRsiBuffer[index]-ExtRsiBuffer[i];
         if(period_difference>0) // The RSI trend is Negative
           {
            point1=ExtRsiBuffer[first_max];                // Max point
            point2=ExtRsiBuffer[second_min];                // The Min point
            time1 = Time[first_max];
            time2 = Time[second_min];
            last_point=second_index;
            SetUpLine(StringConcatenate("Slope Line # ",IntegerToString(line_counter)),1,time1,time2,point1,point2,STYLE_DASH,1,clrBlue);
            line_counter++;
           }
         else if(period_difference<0) // RSI trend is Positive
           {
            point1 = ExtRsiBuffer[first_min];                 // First bottom
            point2 = ExtRsiBuffer[second_max];                // Second Top  
            time1 = Time[first_min];
            time2 = Time[second_max];
            last_point=second_index;
            SetUpLine(StringConcatenate("Slope Line # ",IntegerToString(line_counter)),1,time1,time2,point1,point2,STYLE_DASH,1,clrBlue);
            line_counter++;
           }
        }
     }
//--- return value of prev_calculated for next call
   return(0);
  }
//+------------------------------------------------------------------+
bool TrendCreate(const long            chart_ID=0,// chart's ID
                 const string          name="TrendLine",  // line name
                 const int             sub_window=0,      // subwindow index
                 datetime              time1=0,           // first point time
                 double                price1=0,          // first point price
                 datetime              time2=0,           // second point time
                 double                price2=0,          // second point price
                 const color           clr=clrRed,        // line color
                 const ENUM_LINE_STYLE style=STYLE_SOLID, // line style
                 const int             width=1,           // line width
                 const bool            back=false,        // in the background
                 const bool            selection=false,// highlight to move
                 const bool            ray_right=false,// line's continuation to the right
                 const bool            hidden=false,// hidden in the object list
                 const long            z_order=0) // priority for mouse click
  {
//--- reset the error value
   ResetLastError();
//--- create a trend line by the given coordinates
   if(!ObjectCreate(chart_ID,name,OBJ_TREND,sub_window,time1,price1,time2,price2))
     {
      Print(__FUNCTION__,
            ": failed to create a trend line! Error code = ",GetLastError());
      return(false);
     }
//--- set line color
   ObjectSetInteger(chart_ID,name,OBJPROP_COLOR,clr);
//--- set line display style
   ObjectSetInteger(chart_ID,name,OBJPROP_STYLE,style);
//--- set line width
   ObjectSetInteger(chart_ID,name,OBJPROP_WIDTH,width);
//--- display in the foreground (false) or background (true)
   ObjectSetInteger(chart_ID,name,OBJPROP_BACK,back);
//--- enable (true) or disable (false) the mode of moving the line by mouse
//--- when creating a graphical object using ObjectCreate function, the object cannot be
//--- highlighted and moved by default. Inside this method, selection parameter
//--- is true by default making it possible to highlight and move the object
   ObjectSetInteger(chart_ID,name,OBJPROP_SELECTABLE,selection);
   ObjectSetInteger(chart_ID,name,OBJPROP_SELECTED,selection);
//--- enable (true) or disable (false) the mode of continuation of the line's display to the right
   ObjectSetInteger(chart_ID,name,OBJPROP_RAY_RIGHT,ray_right);
//--- hide (true) or display (false) graphical object name in the object list
   ObjectSetInteger(chart_ID,name,OBJPROP_HIDDEN,hidden);
//--- set the priority for receiving the event of a mouse click in the chart
   ObjectSetInteger(chart_ID,name,OBJPROP_ZORDER,z_order);
//--- successful execution
   return(true);
  }
//+------------------------------------------------------------------+
void SetUpLine(string name,int subwindow,datetime time1,datetime time2,double price,double price2,ENUM_LINE_STYLE linestyle,int width,color clr)
  {
   bool Line=TrendCreate(0,name,subwindow,time1,price,time2,price2,clr,linestyle,width,false,false,false,false,0);
   return;
  }
 
Marco vd Heijden:

You start to draw from the previous bar and continue drawing to the current bar.

This means that for time1 you need one bar up or older.

Thanks ill try it and give feedback

 
Stanislav Ivanov:

Thanks ill try it and give feedback

So then, just to ask - in the case how to calculate when should be the time1 value ? Its just the first time i make such project.

Thanks 


time1 is where the trendlines starts and time2 parameter is where it stops.

So if you have a price value you can start to draw at the current bar + 1 which is one bar older then the current bar and end drawing at the current bar.

You can also draw to the next bar that is bar -1 but you will run into problems when trying to draw bar 0 because bar 0 -1 minus one is -1 and your line will connect to 1970.

But  this is for drawing in experts.

In indicators you only have to write your price value to a indicator buffer and it will show up just fine.

so you have to replace the 

bool TrendCreate()

function with an indicator buffer and fill it's value with the desired price reading.

have you tried to generate a indicator template ?

You can specify number of buffers and needed parameters and it will generate a nice template for you.

//+------------------------------------------------------------------+
//|                                                     Template.mq5 |
//|        Copyright 2018,Marco vd Heijden,MetaQuotes Software Corp. |
//|                                             https://www.mql5.com |
//+------------------------------------------------------------------+
#property copyright "Copyright 2018,Marco vd Heijden,MetaQuotes Software Corp."
#property link      "https://www.mql5.com"
#property version   "1.00"
#property indicator_separate_window
#property indicator_buffers 1
#property indicator_plots   1
//--- plot Label1
#property indicator_label1  "Label1"
#property indicator_type1   DRAW_LINE
#property indicator_color1  clrRed
#property indicator_style1  STYLE_SOLID
#property indicator_width1  1
//--- input parameters
input int      parameter_1=80;
input int      parameter_2=20;
//--- indicator buffers
double         Label1Buffer[];
//+------------------------------------------------------------------+
//| Custom indicator initialization function                         |
//+------------------------------------------------------------------+
int OnInit()
  {
//--- indicator buffers mapping
   SetIndexBuffer(0,Label1Buffer,INDICATOR_DATA);

//---
   return(INIT_SUCCEEDED);
  }
//+------------------------------------------------------------------+
//| Custom indicator iteration function                              |
//+------------------------------------------------------------------+
int OnCalculate(const int rates_total,
                const int prev_calculated,
                const datetime &time[],
                const double &open[],
                const double &high[],
                const double &low[],
                const double &close[],
                const long &tick_volume[],
                const long &volume[],
                const int &spread[])
  {
//---
   int limit;
   if(prev_calculated==0)
     {
      limit=0;
     }
   else
     {
      limit=prev_calculated-1;
     }
//--- calculate value
   for(int i=limit;i<rates_total && !IsStopped();i++)
     {
      Label1Buffer[i]=open[i];// <-- assign some value to the buffer here, in this case just the open price
     }
//--- return value of prev_calculated for next call
   return(rates_total);
  }
//+------------------------------------------------------------------+

I took the time to generate a very simple example for you so easy to understand because it will just fill the buffer with the open price.


thanks
 
but there is an issue - i want not only the RSI indicator to be shown, but lines "zig-zagging " around the RSI extremums constantly, is this achievable with setting the price values to buffers ?
 

Of course you can do that, it was designed to do that.

Just add more buffers.

Here is a quick and simple Donchian Channel example with 3 Buffers:

//+------------------------------------------------------------------+
//|                                            Donchian-reversed.mq5 |
//|        Copyright 2018,Marco vd Heijden,MetaQuotes Software Corp. |
//|                                             https://www.mql5.com |
//+------------------------------------------------------------------+
#property copyright "Copyright 2018,Marco vd Heijden,MetaQuotes Software Corp."
#property link      "https://www.mql5.com"
#property version   "1.00"
#property indicator_chart_window
#property indicator_buffers 3
#property indicator_plots   3
//--- plot High
#property indicator_label1  "High"
#property indicator_type1   DRAW_LINE
#property indicator_color1  clrAliceBlue
#property indicator_style1  STYLE_SOLID
#property indicator_width1  1
//--- plot Center
#property indicator_label2  "Center"
#property indicator_type2   DRAW_LINE
#property indicator_color2  clrYellow
#property indicator_style2  STYLE_SOLID
#property indicator_width2  1
//--- plot Low
#property indicator_label3  "Low"
#property indicator_type3   DRAW_LINE
#property indicator_color3  clrAliceBlue
#property indicator_style3  STYLE_SOLID
#property indicator_width3  1
//--- input parameters
input int      period=20;// Period
//--- indicator buffers
double         HighBuffer[];
double         CenterBuffer[];
double         LowBuffer[];
//+------------------------------------------------------------------+
//| Custom indicator initialization function                         |
//+------------------------------------------------------------------+
int OnInit()
  {
//--- indicator buffers mapping
   SetIndexBuffer(0,HighBuffer,INDICATOR_DATA);
   SetIndexBuffer(1,CenterBuffer,INDICATOR_DATA);
   SetIndexBuffer(2,LowBuffer,INDICATOR_DATA);

//---
   return(INIT_SUCCEEDED);
  }
//+------------------------------------------------------------------+
//| Custom indicator iteration function                              |
//+------------------------------------------------------------------+
int OnCalculate(const int rates_total,
                const int prev_calculated,
                const datetime &time[],
                const double &open[],
                const double &high[],
                const double &low[],
                const double &close[],
                const long &tick_volume[],
                const long &volume[],
                const int &spread[])
  {
//---
   int limit;
   if(prev_calculated==0)
     {
      limit=0;
     }
   else
     {
      limit=prev_calculated-1;
     }
//--- calculate values
   for(int i=limit;i<rates_total && !IsStopped();i++)
     {
      //--- high   
      HighBuffer[i]=high[ArrayMaximum(high,i,period)];

      //--- low
      LowBuffer[i]=low[ArrayMinimum(low,i,period)];

      //--- center
      CenterBuffer[i]=(HighBuffer[i]+LowBuffer[i])/2;
     } 
//--- return value of prev_calculated for next call
   return(rates_total);
  }
//+------------------------------------------------------------------+
 

Thanks !

I appreciate it 


But is this achievable this way !

its quite different from what you have sent

 
Stanislav Ivanov:

But is this achievable this way !

its quite different from what you have sent

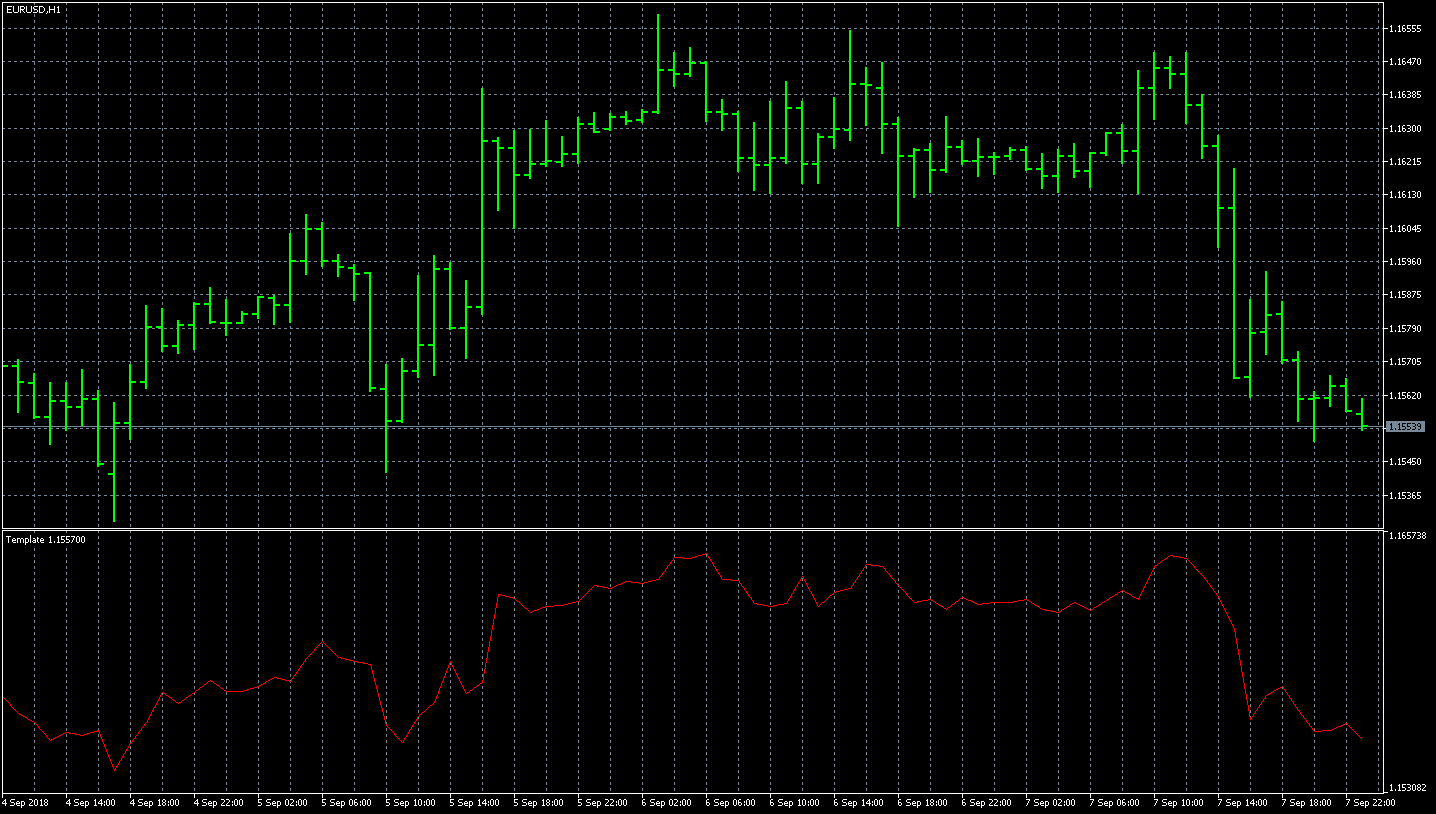
with what code did you produce this chart ? This is exactly what i'm looking for :) Would you share ?

 
siemsons:

with what code did you produce this chart ?

I havent produced it yet, its what im aiming for ! I found it as image from a friend

Reason: