Anyone has the mq4 for this indicator
Hello,
I have been looking in the codebase and over the internet but dont seem to find the mq4 version of this indicator that detects support and resistance.
I am attaching the ex4 that I found and a pic of indi on a chart.
I would like to build an EA around this indi but I have no idea how to get the reading out of the indicator and whether it is possible to do it with the version on hand.
Cheers!
- pete
I seems to me like the Top and Bottoms of a Zig Zag indicator...
;)
I seems to me like the Top and Bottoms of a Zig Zag indicator...
;)
I assumed that also, based on the input data screen of the indi... but they are using some kind of filter also to screen out some of the tops and bottoms and I would like to know what it really is. that s why i posted here.
It repaints heavily as is!!
It it's old enough (which it seems to be) you can use one of those "decompilers" on it. It's illegal and immoral, but if all you want to do is look into the code I don't see a problem.
It should work better on markets like GBP/USD, AUD/USD, AUD/CAD and maybe some indexes than EUR/USD. Even if it is repainting.
I assumed that also, based on the input data screen of the indi... but they are using some kind of filter also to screen out some of the tops and bottoms and I would like to know what it really is. that s why i posted here.
It repaints heavily as is!!
Fractals plot on the third last bar if two consecutive higher highs/lower lows have been formed.
#property strict
#property indicator_chart_window
#property indicator_buffers 2
#property indicator_plots   2
//--- plot Resistance
#property indicator_label1  "Resistance"
#property indicator_type1   DRAW_ARROW
#property indicator_color1  clrRed
#property indicator_style1  STYLE_SOLID
#property indicator_width1  1
//--- plot Support
#property indicator_label2  "Support"
#property indicator_type2   DRAW_ARROW
#property indicator_color2  clrBlue
#property indicator_style2  STYLE_SOLID
#property indicator_width2  1
//--- indicator buffers
double         ResistanceBuffer[];
double         SupportBuffer[];
//+------------------------------------------------------------------+
//| Custom indicator initialization function                         |
//+------------------------------------------------------------------+
int OnInit()
  {
//--- indicator buffers mapping
   SetIndexBuffer(0,ResistanceBuffer);
   SetIndexBuffer(1,SupportBuffer);
//--- setting a code from the Wingdings charset as the property of PLOT_ARROW
   SetIndexArrow(0,119);
   SetIndexArrow(1,119);
//---
   return(INIT_SUCCEEDED);
  }
//+------------------------------------------------------------------+
//| Custom indicator iteration function                              |
//+------------------------------------------------------------------+
int OnCalculate(const int rates_total,
                const int prev_calculated,
                const datetime &time[],
                const double &open[],
                const double &high[],
                const double &low[],
                const double &close[],
                const long &tick_volume[],
                const long &volume[],
                const int &spread[])
  {
//---
   int begin=!prev_calculated?rates_total-2:rates_total-prev_calculated+2;
//---
   for(int i=begin;i>=0 && !_StopFlag;i--)
     {
//---
      ResistanceBuffer[i]=iFractals(_Symbol,_Period,MODE_UPPER,i)>0?high[i]:ResistanceBuffer[i+1];
//---
      SupportBuffer[i]=iFractals(_Symbol,_Period,MODE_LOWER,i)>0?low[i]:SupportBuffer[i+1];
     }
//--- return value of prev_calculated for next call
   return(rates_total);
  }
//+------------------------------------------------------------------+
Thanks Ernst. I have never worked with fractals before but I am experimenting now.
I have attached an EA to detect the last 3 fractals and draw a Sup/Res line when, at least 2 of the last 3, line up within one pip. Eventually, I will be adding to it the trading part..
The trading strategy I want to test is to go long when
- Support line is above the 50 SMA
- EMA4 crosses EMA6 upwards
- stop below the last swing low, last 5 bars before the entry
- TP = 40 with 20 trail (or any other values)
Short is opposite.
Anyone interested in this strategy so to explore it together?
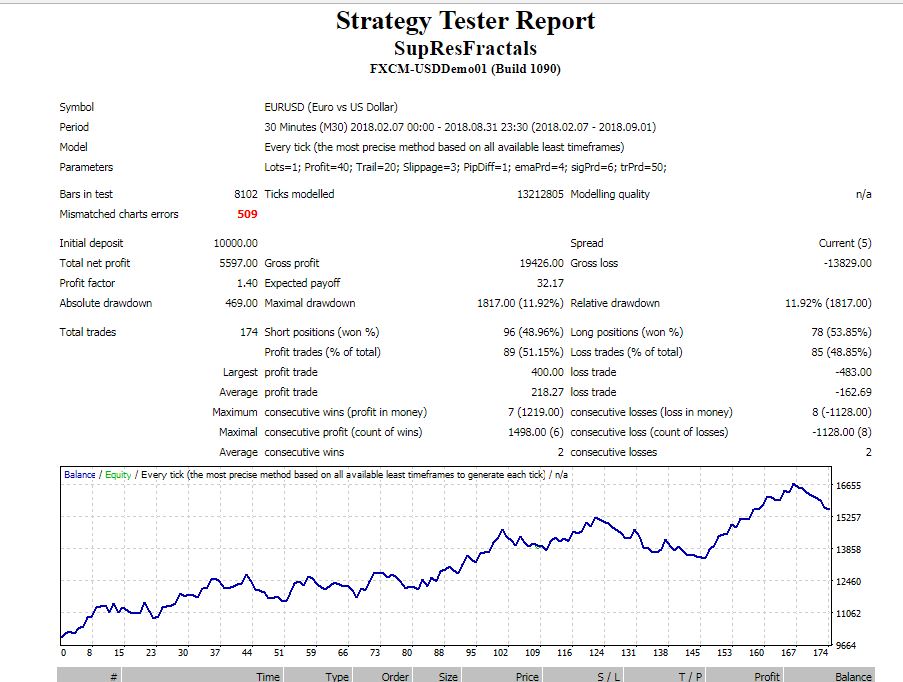
Well, I thought I wont have time to work on it today but I did :))
Attached the EA with the first test result.
I am trying to attach the report but I am getting an error "invalid format" so I copied and pasted it. Modelling quality is n/a and 509 errors.
EDIT: I am attaching the pic of the report - the report is till 31/8 but the tester stopped working on 31/7 - have no idea what happened!!

- www.metatrader5.com
- Free trading apps
- Over 8,000 signals for copying
- Economic news for exploring financial markets
You agree to website policy and terms of use
Hello,
I have been looking in the codebase and over the internet but dont seem to find the mq4 version of this indicator that detects support and resistance.
I am attaching the ex4 that I found and a pic of indi on a chart.
I would like to build an EA around this indi but I have no idea how to get the reading out of the indicator and whether it is possible to do it with the version on hand.
Cheers!
- pete