Indicators: mslmsh - Market structure low/high
nice indicator....
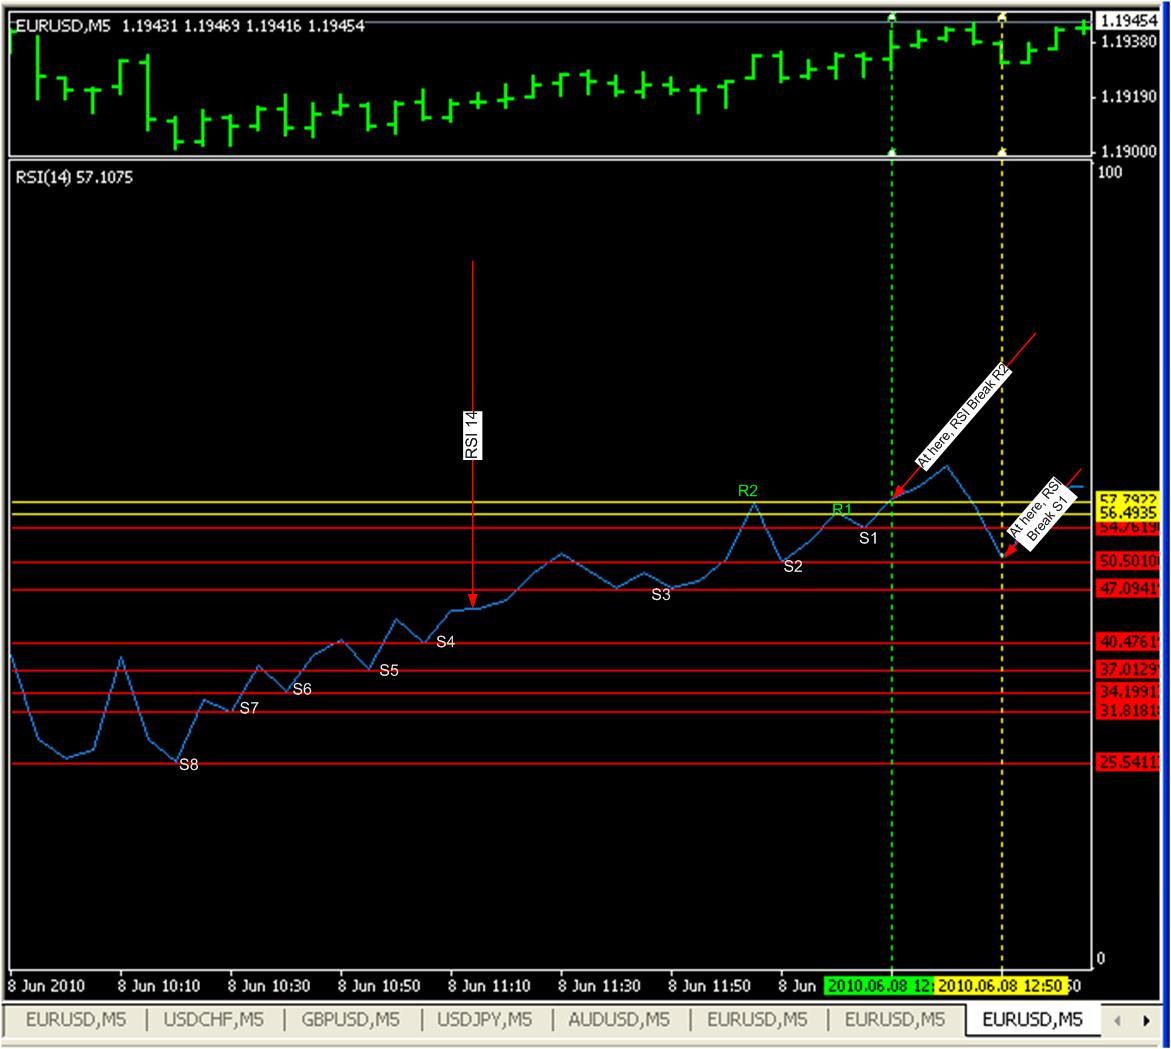
how to make it in RSI 14?
and create the line for support/resistnace in RSI 14?
nice indicator....
how to make it in RSI 14?
and create the line for support/resistnace in RSI 14?
The relative strength is a different thing it does not have resistances. Local highs and local lows are used to find break outs of a trend, the RSI is to find a trend but it will triger only if a trend is already going. The break out strategy is used to start trading before the trend establishes.
mslmsh is good to be combined with bollionger bands, if there is a local high or low outside of the bands it is likley to bounce.
(I did not count if this is relevant and happens often, so some time will write an ea to back test this.
something like http://www.doshur.com/forex/dsr.asp
I think their is some real promise with this. Thanks for sharing.
When I look back in time looking for profitable patterns, the screen gets overloaded with yellow, red, orange and blue horizontal lines.
How can I get rid of these?
It repaints.
- Free trading apps
- Over 8,000 signals for copying
- Economic news for exploring financial markets
You agree to website policy and terms of use
mslmsh - Market structure low/high:
Author: Thomas Quester