´please write results.
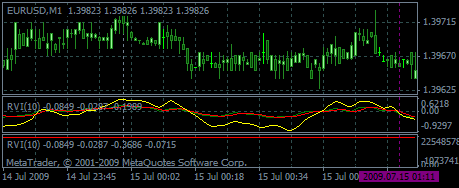
plan of trading with this indicator:
if Lowest position under red line is==buying.
if Highest position upeer of red line is=close buying,now selling{uses waves}
small tip: signals:if most +next most=draw line from most to next most to show current trand route.
yellow line=Price line;
red line=Middle/Center Line;
yellow line=Price line;
red line=Middle/Center Line;
in 2 version
please i didn't understand this indicator
please some shart to understand
to understand:
this indicator calculcate better realtive values that RVI Indicator.
to profit:
if is yellow line under red line and is on most down position/now trend is up/ must open to buy,next if is up red line or most high position/must trend is down/must close and open diferrent
i today profit 684 EUR and less 80 eur
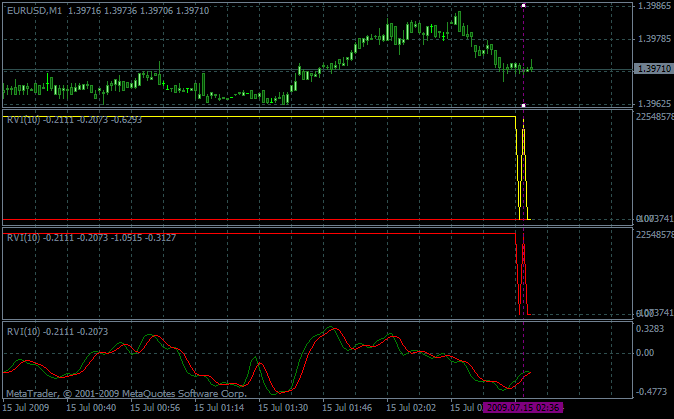
i got this (srvi1&2); is it that bug? (been recompiled - doesn't help)


another bug: do you have to compile it constantly? : ))))))))))))) (otherwise in a few seconds it does this):


- Free trading apps
- Over 8,000 signals for copying
- Economic news for exploring financial markets
You agree to website policy and terms of use
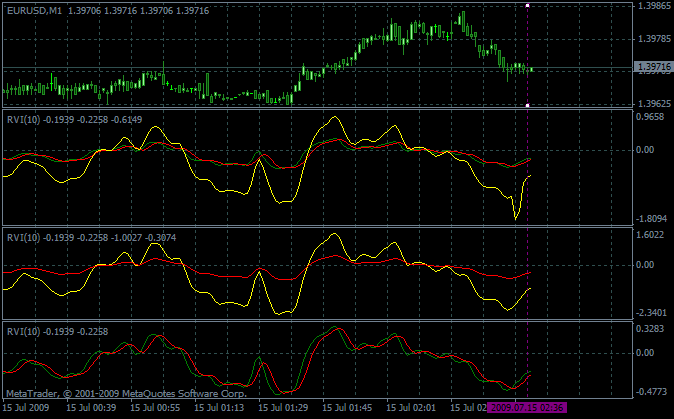
Edited RVI indicator:
Author: Pavol