Indicators: Pattern Recognition v1.0
Nice piece of code. Better if you turn the description text to 90°.
... I did it in the one I customized for myself, works great.
Thanks for sharing.
What kind of change do we need to built to turn the description text to 90°,?
A good idea is to put one word for each line
example:
Three Outside Down,
it will be
Three
Outside
Down
This is 'potentially' a really great indicator but, as it says in the code, it is a work in progress. Has anyone else found that it only displays a few of the patterns it is supposed to and, if so, has anyone been able to correct it? Sadly I'm completely illiterate in the coding area so I can't help at all.
Look forward to hearing from other users.
Regards
-Llamedos
Nice piece of code.
I took part of your code and placed it in candlestick function in my EA. I disabled other input features of my EA and backtested from 2004 to 2007 H1 GBPUSD, relying solely on the candlestick identification.
Entry rules are as follows..
Go long once a bullish candle has been formed.. target 150 pips, stop loss 150 pips
Go short once a bearish candle has been formed.. target 150 pips, stoploss 150 pips
Here is the report
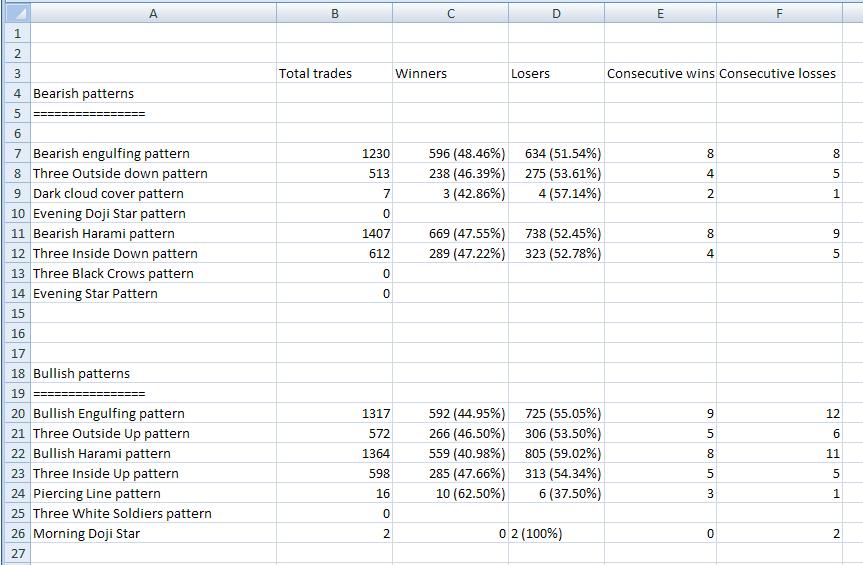
Some of the candles don't show up at all. All the candles have less than 50% profitability.
I'm not sure if candlestick trading is a myth
Hi MBA - thanks for posting up the results of your tests.
The first thing that springs to my mind is that you may be using stop losses that are way too big in proportion to the required profits. The reason I'm saying this is, as far as I'm aware, these patterns are negated if price movement exceeds certain parameters. Therefore reducing the stop loss to the point of negation may help with the profit margin.
I think an average of a 50/50 win ratio - especially as all of those wins are +150 points is very encouraging and I would be interested in seeing a rerun of the test with a more thoughtful stop loss. Sorry but I don't have the time to make any concrete suggestions as to where the stop losses should be put but, I will try and have a look at it tomorrow and post up some suggestions.
Secondly, I would be concerned about the candles that didn't show up. Is there any way that you can check/correct the code to ensure that it gets them all?
Regards
Llamedos.
Hi MBA
Having refreshed my memory regarding these patterns, it would seem to me that they should all be considered as 'failed' once price moves below the pattern (in bullish signals) and the above in the case of bearish signals as you can see from the list below.
Bullish Engulfing pattern - below the low of the two candle pattern
Three Outside Up pattern - below the low of the three candle pattern
Bullish Harami pattern - below the low of the two candle pattern
Three Inside Up pattern - below the low of the three candle pattern
Piercing Line pattern - below the low of the two candle pattern
Three White Soldiers pattern - below the low of the three candle pattern
Morning Doji Star - below the low of the two candle pattern
As for the stop loss/profit expectation I mentioned yesterday, I realise that in some of these cases putting the stop loss (say 20 points) below the low of a pattern will still result in a 150 point stop loss - and possibly more. Therefore I think you would do well to consider the time frame/stop loss/profit target conundrum see if you can reconcile the three and find the best time frame in your chosen instrument to give you a comfortable risk. Once you have done this you can then look for a respectable profit margin. One possible way, for example, would be to change the code so the profit expectation was three times the stop loss.
Also in you post you said that some of the candles don't show up at all - can you give some examples on this? Was it random in that (say) an engufing pattern showed up once but then missed the next two occurances. Or did the programme just not 'see' the three white soldiers at all when, in fact, there was two clear examples.
Depending upon the circumstances could it be that the code did actually seen the pattern but then that pattern superceeded by the next bar as in the case of a bullish Harami. This two bar pattern is not only a pattern in itself, but it is also the first two bars of the three bar 'Three Inside'. Just something for you to consider.
I look forward to reading you comments on this as I feel this is potentially a really good EA.
Regards
-Llamedos
How do you get this to work? and to back test it using the EA?
i have copied it to the \expert folder. and run it on the stategy tester but it doesn't work. please advise.
[Added:] i can see text when the EA is run initially, after a short while it disappears. Can you explain how to get this working.
THanks for the code.!!
- Free trading apps
- Over 8,000 signals for copying
- Economic news for exploring financial markets
You agree to website policy and terms of use
Pattern Recognition v1.0:
Author: Collector