Is it possible not to snap to the grids?
I want to draw tiny boxes around certain (X,Y) points, where X are datetime, and Y are prices.
I use the following, trying to get my width as less than a candle width:
Note: Time() is a custom made function to emulate MQL4 Time[] (I got inspired by the internet)
However, no matter how I change the "/4" factor, the chart will insist on snapping to the gridelines, so I end up with the following chart:
Use a Text object , placed on the bar time with a webdings/wingdings font and an icon
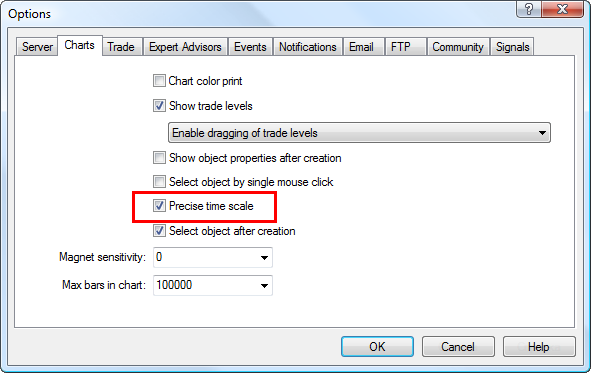
It is not snapping to grid lines. It is snapping to bars. In MT4 that is all you can do. In MT5 IIRC there is a setting that allows objects between bars.
"In MT5 IIRC there is a setting that allows objects between bars."
I think this is what he means.
I think this is what he means.
I want to draw tiny boxes around certain (X,Y) points, where X are datetime, and Y are prices.
I use the following, trying to get my width as less than a candle width:
Note: Time() is a custom made function to emulate MQL4 Time[] (I got inspired by the internet)
However, no matter how I change the "/4" factor, the chart will insist on snapping to the gridelines, so I end up with the following chart:
- Free trading apps
- Over 8,000 signals for copying
- Economic news for exploring financial markets
You agree to website policy and terms of use
I want to draw tiny boxes around certain (X,Y) points, where X are datetime, and Y are prices.
I use the following, trying to get my width as less than a candle width:
Note: Time() is a custom made function to emulate MQL4 Time[] (I got inspired by the internet)
However, no matter how I change the "/4" factor, the chart will insist on snapping to the gridelines, so I end up with the following chart: