Indicators: PVT
The indicator does not plot anything in the window. I have MT5 and new to programming. Any reason the indicator does not plot in window?
The indicator does not plot any data, nor is the indicator name plotted. The only process that occurs is a blank window below price. I am new to programming and can not see why nothing is displayed. I even added PloitIndexSetInterger(0,PLOT_DRAW_BEGIN,20) to line 33, which yielded no result. Any idea why the indicator does nothing but create a window?
I used this indicator for a long time.
I apply an adaptive moving average to it to use it.
PVT>AMA = bullish
PVT<AMA = bearish
My entry points are made when the PVT breaks and then comes back to touch its AMA.
I found that this indicator was not lying to me because it followed very well what the price was doing. But.....
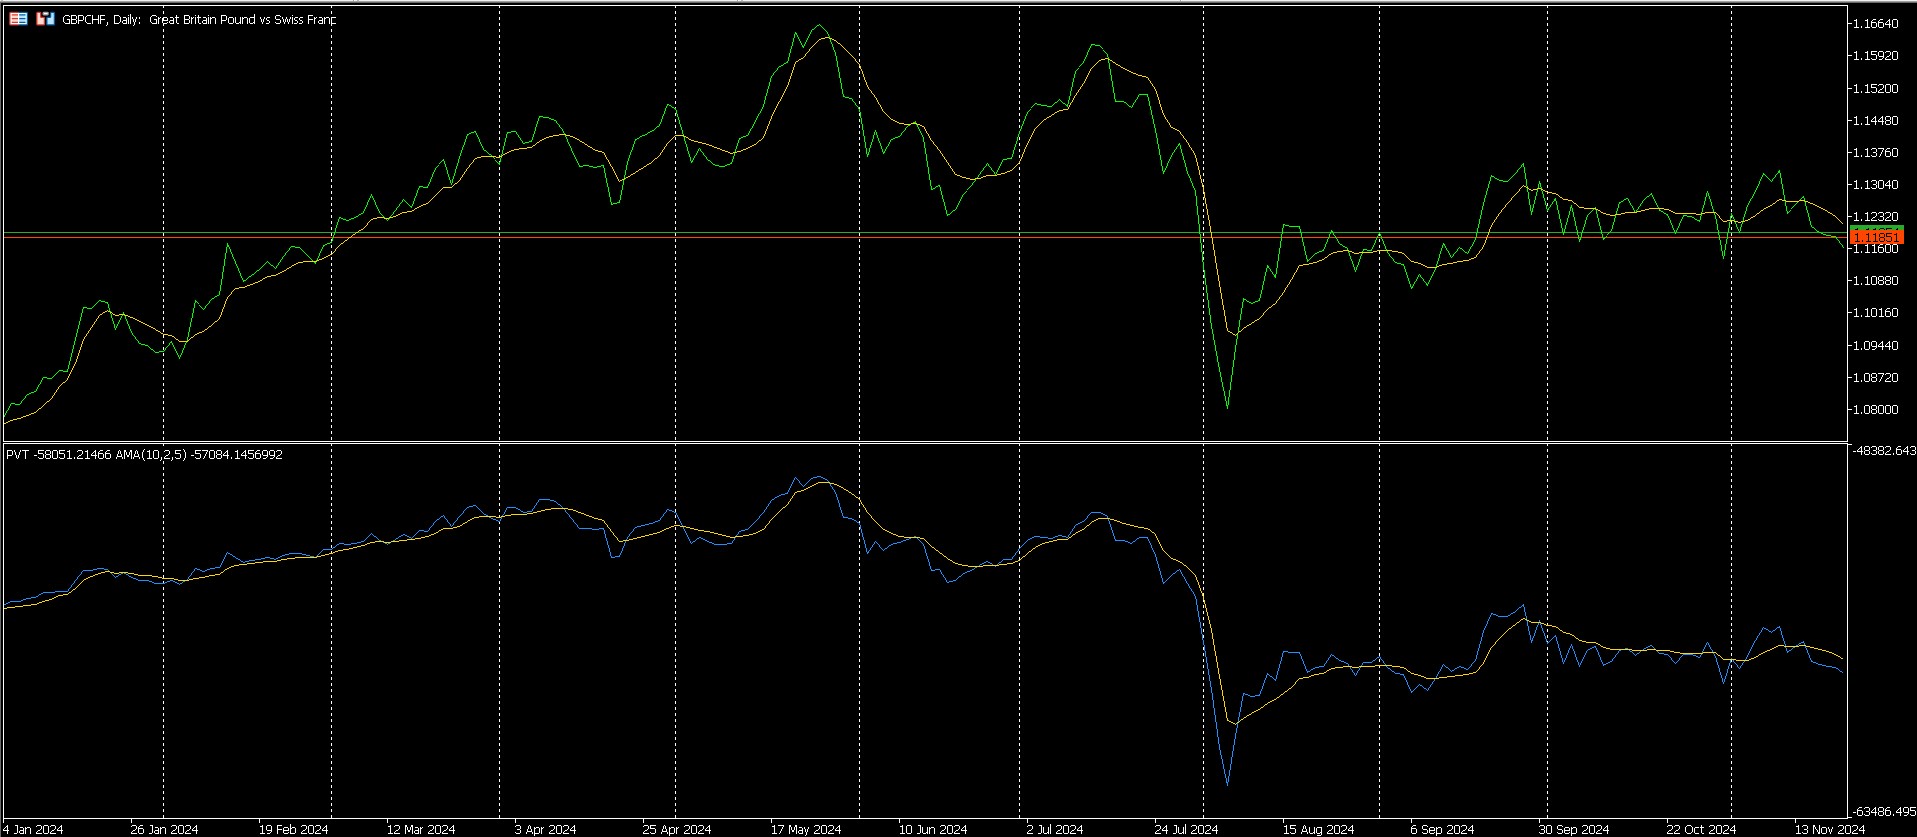
I realized one day that it does not tell me anything more than copying the price. So it is useless and here is the proof :
At the top: price (line displayed) + AMA (10,2,5)
At the bottom PVT + AMA (10,2,5)
The price chart is exactly the same as that of the PVT except for very very rare divergences but irrelevant exceptions.
You are missing trading opportunities:
- Free trading apps
- Over 8,000 signals for copying
- Economic news for exploring financial markets
Registration
Log in
You agree to website policy and terms of use
If you do not have an account, please register
PVT:
Price Volume Trend (PVT) is an indicator of price trend and volume, similar to the standard On Balance Volume (OBV) indicator.
The indicator has no configurable parameters.
Calculation formula:
Interpretation of indicator values is similar to standard On Balance Volume and Accumulation/Distribution (AD).
Author: Scriptor