double STH[];
double STL[];
double LBRKR;
double SBRKR;
double BRKR_L[];
double BRKR_S[];
Use descriptive variable names so that others can easier understand what you are trying to do.
You are more likely to get help then.
Use descriptive variable names so that others can easier understand what you are trying to do.
You are more likely to get help then.
I do not know exactly what you are trying to do, but I think that this may be good.
int start()
  {
   int cnt, i=history-PER;
   double price_high, price_low;
   //LowestHigh=iCustom(NULL,0,"MS_SR",0,0);            //assigning latest high and low as highesthigh and lowestlow
   //HighestLow=iCustom(NULL,0,"MS_SR",1,0);
   //i=history;

   while(i>=0)
     {
      LowestHigh=iCustom(NULL,0,"MS_SR",0,i);
      HighestLow=iCustom(NULL,0,"MS_SR",1,i);

      //for(int cnt=0;cnt<PER;cnt++) //loop for determining lowesthigh and highestlow
      for(cnt=1;cnt<PER;cnt++)
        {
         //high[cnt]=iCustom(NULL,0,"MS_SR",0,cnt);
         //low[cnt]=iCustom(NULL,0,"MS_SR",1,cnt);
         price_high=iCustom(NULL,0,"MS_SR",0,i+cnt);
         price_low =iCustom(NULL,0,"MS_SR",1,i+cnt);

         //if(LowestHigh>high[cnt])LowestHigh=high[cnt];
         //if(HighestLow<low[cnt])HighestLow=low[cnt];
         if(LowestHigh>price_high)
            LowestHigh=price_high;

         if(HighestLow<price_low)
            HighestLow=price_low;
        }

      //HighLine[cnt]=LowestHigh;                         //assigning 50period highs and lows to indicator array
      //LowLine[cnt]=HighestLow;
      HighLine[i]=LowestHigh;
      LowLine[i] =HighestLow;

      i--;
     }

   return(0);
  }
I do not know exactly what you are trying to do, but I think that this may be good.
Thank you! This is what I've been trying to accomplish.
I've tried another solution yesterday...
int start()
  {
   i=history;
   for (int cnt=history-1;cnt>=0;cnt--)                      //loop for determining lowesthigh and highestlow
   {  high[cnt]=iCustom(NULL,0,"MS_SR",0,cnt);
      low[cnt]=iCustom(NULL,0,"MS_SR",1,cnt);
      HighLine[cnt]=high[ArrayMinimum(high,PER,cnt)];
      LowLine[cnt]=low[ArrayMaximum(low,PER,cnt)];
   }
   return(0);
  }
but this is giving me problems when I implement the indicator into an EA
"incorrect start position for ArrayMaximum function"
but this is giving me problems when I implement the indicator into an EA
"incorrect start position for ArrayMaximum function"
Maybe buffers are not prepared.
Maybe buffers are not prepared.
what do you mean with that? can you explain?
You defined 4 arrays in the 1st post, but only 2 buffers were prepared.
You defined 4 arrays in the 1st post, but only 2 buffers were prepared.
they were all prepared... but the error still occurs...
//+------------------------------------------------------------------+
//|                                                                  |
//|        1BRKR                                                     |
//|                                                                  |
//+------------------------------------------------------------------+

#property indicator_chart_window
#property indicator_buffers 4
#property indicator_color1 Green
#property indicator_color2 Red
input int PER     =50;                 //period
input int history =3000;

double high[];
double low[];
double HighLine[3000];
double LowLine[];
int i;

void init()
{

   SetIndexBuffer(0,HighLine);
   SetIndexStyle(0,DRAW_LINE,2,2);
   SetIndexEmptyValue(0,0.0);

   SetIndexBuffer(1,LowLine);
   SetIndexStyle(1,DRAW_LINE,2,2);
   SetIndexEmptyValue(1,0.0);

   SetIndexBuffer(2,high);
   SetIndexStyle(2,EMPTY,EMPTY,EMPTY,clrNONE);
   SetIndexBuffer(3,low);
   SetIndexStyle(3,EMPTY,EMPTY,EMPTY,clrNONE);
return;
}

int start()
  {
   i=history;
   for (int cnt=history-1;cnt>=0;cnt--)                      //loop for determining lowesthigh and highestlow
   {  high[cnt]=iCustom(NULL,0,"MS_SR",0,cnt);
      low[cnt]=iCustom(NULL,0,"MS_SR",1,cnt);
      HighLine[cnt]=high[ArrayMinimum(high,PER,cnt)];
      LowLine[cnt]=low[ArrayMaximum(low,PER,cnt)];
   }
   return(0);
  }

//+------------------------------------------------------------------+
Forum on trading, automated trading systems and testing trading strategies
Sergey Golubev, 2018.03.11 05:55
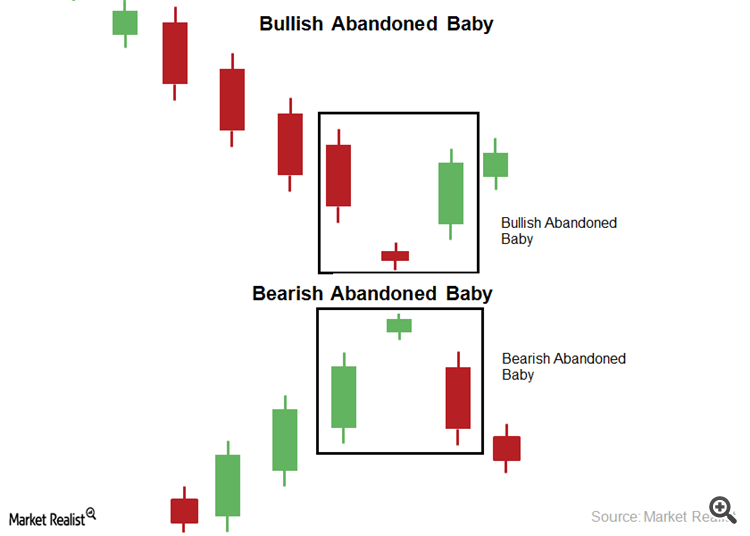
Abandoned Baby candlestick pattern (based on the article)
- "The Bullish Abandoned Baby candlestick pattern is a reversal pattern. The pattern has three candles. It forms at the bottom of a trend. In this pattern, the first candle is any long and bearish candle. The second candle is a small and bearish candle—or a Doji. The second candle doesn’t overlap the first or third candle. The third candle is any long and bullish candle."
- "The Bearish Abandoned Baby pattern is a reversal pattern. The pattern has three candles. It forms at the peak of a trend. In this pattern, the first candle is long and bullish. The second candle is a small and bullish candle—or a Doji. The second candle doesn’t overlap the first or third candle. The third candle is long and bearish."
- Free trading apps
- Over 8,000 signals for copying
- Economic news for exploring financial markets
You agree to website policy and terms of use

Hi,
I'm trying to create a custom indicator that calculates the lowest highs and highest lows over a certain period and shows it on the chart as a line.
It's based on an arrow indicator I've created myself that shows dots as support and resistance until a new high/low is formed. (you can replace it by iFractals() with a few changes beceause fractals aren't always seen on the chart)
The idea is to show two lines: line 1 at 50period lowest high and line 2 at 50period highest low. I just couldn't get it right. And I know it should be EASY...
Please help me out here!! I'm new at coding so an explanation would be nice too.
Thanks!