Indicators: Heiken-Ashi
Explain why this code is in the indicator code:
      if (haOpen>haClose)
        {
         //--- bullish candle
         ExtLBuffer[i]=haLow;
         ExtHBuffer[i]=haHigh;
         ExtOBuffer[i]=haOpen;
         ExtCBuffer[i]=haClose;
        }
      else
        {
         //--- bearish candle
         ExtLBuffer[i]=haHigh;
         ExtHBuffer[i]=haLow;
         ExtOBuffer[i]=haClose;
         ExtCBuffer[i]=haOpen;
        }
it confuses openings with closings and highs with lows.
On MT4 it was necessary because it was built through the histogram, but why is it in MT5?
I tried to take data for the Expert Advisor, I couldn't understand what was going on for a long time, until I removed the condition and that in the block else.
Maybe you can correct it!
Adjusted. Thank you.
Strings
      double haHigh=MathMax(High[i],MathMax(haOpen,haClose));
      double haLow=MathMin(Low[i],MathMin(haOpen,haClose));
Also redundant, it is quite sufficient and
      double haHigh=MathMax(High[i],haOpen);
      double haLow=MathMin(Low[i],haOpen);
how can i use this in several timeframes ?
icustom does not work or iam wrong?
how can i use this in several timeframes ?
icustom does not work or iam wrong?
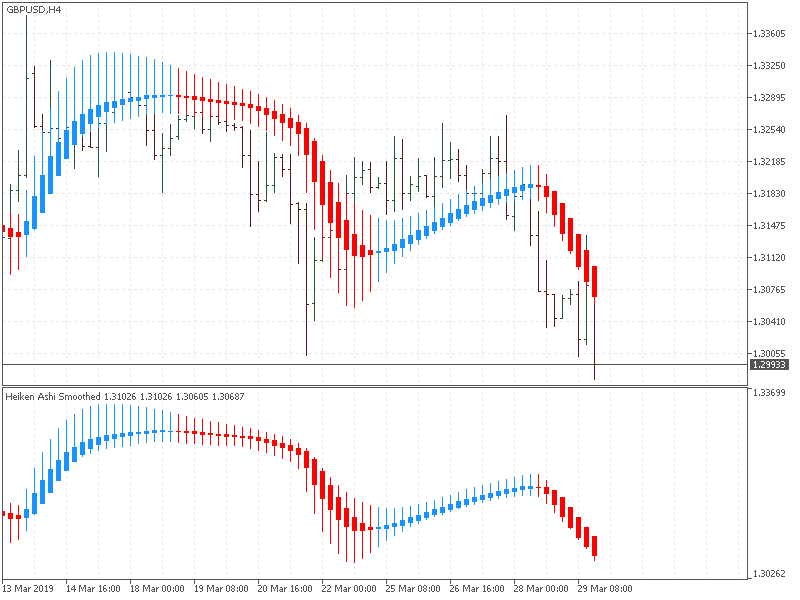
An Example of a Trading System Based on a Heiken-Ashi Indicator
With the appearance of candlestick chart in the U.S., more than two decades ago, there was a revolution in the understanding of how the forces of bulls and bears work on the Western markets. Candlesticks became a popular trading instrument, and traders began working with them in order to ease the reading of the charts. But the interpretation of candlesticks differ from one another.
One of these methods, which changes the traditional candlestick chart, and facilitates its perception, is called the Heikin Ashi technology.
Hello, could you edit your Heiken ashi script like down below?
Curr Close HA = (Prev Open + Prev Close + Curr Open + Curr Close)/4
Curr Open HA = (Prev Close HA + Prev Open HA)/2
Curr Low HA = Take the lowest value of the three - Curr Close HA, Curr Open HA and Curr Low
Curr High HA = Take the highest value of the three - Curr Close HA, Curr Open HA and Curr High
I'll apreciate your help...
From the search -
- Free trading apps
- Over 8,000 signals for copying
- Economic news for exploring financial markets
You agree to website policy and terms of use
Heiken-Ashi:
Author: MetaQuotes Software Corp.