Indicators: Waddah Attar RSI Level
how does the RSI values (ranging from 0 to 100) scaled into the price window ?
This indicator ROCKS.
how does the RSI values (ranging from 0 to 100) scaled into the price window ?
The Secret In the Code
I have tried it and it gave me similar lines but it labeled each line with day low, H4 high and there are doublication in each line, and can you explain about this indicator like what these lines represent,,,,,,,
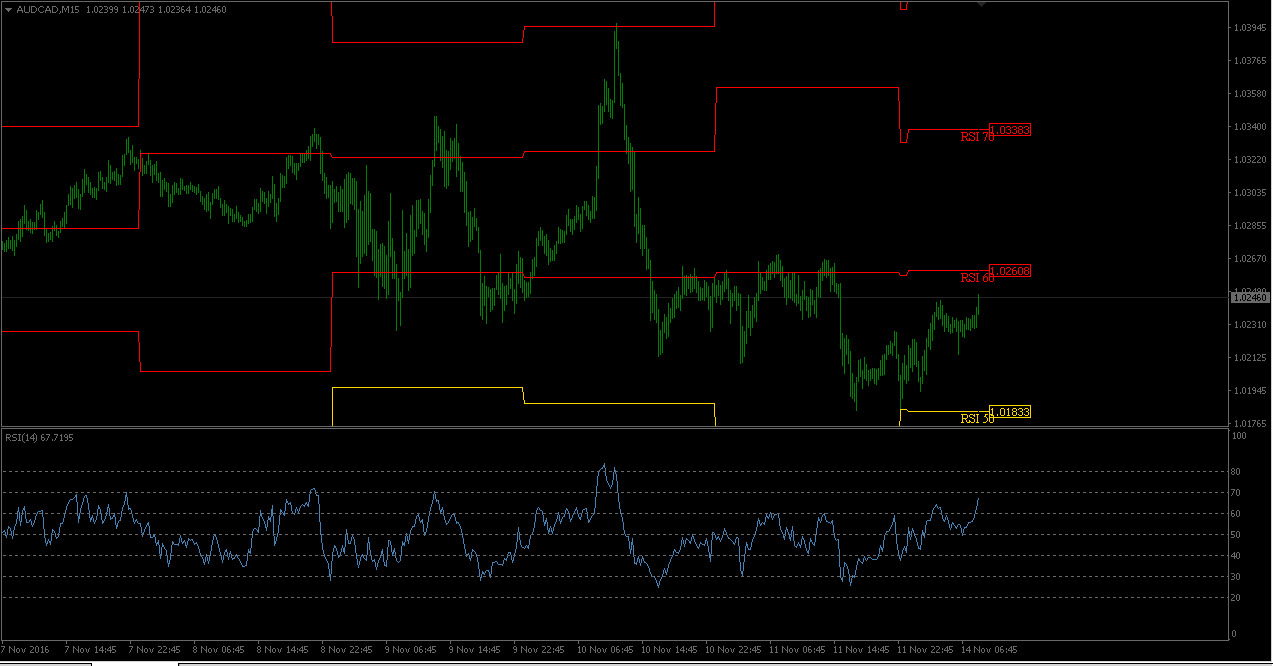
Can you help me for this indicator RSI which draws lines on chart because I don't understood this problem: value of normal RSI indicator (window below) is not the same of value RSI lines on chart. Both are on close price ofcourse.
See image please! :-)
update chart
Can you help me for this indicator RSI which draws lines on chart because I don't understood this problem: value of normal RSI indicator (window below) is not the same of value RSI lines on chart. Both are on close price ofcourse.
See image please! :-)
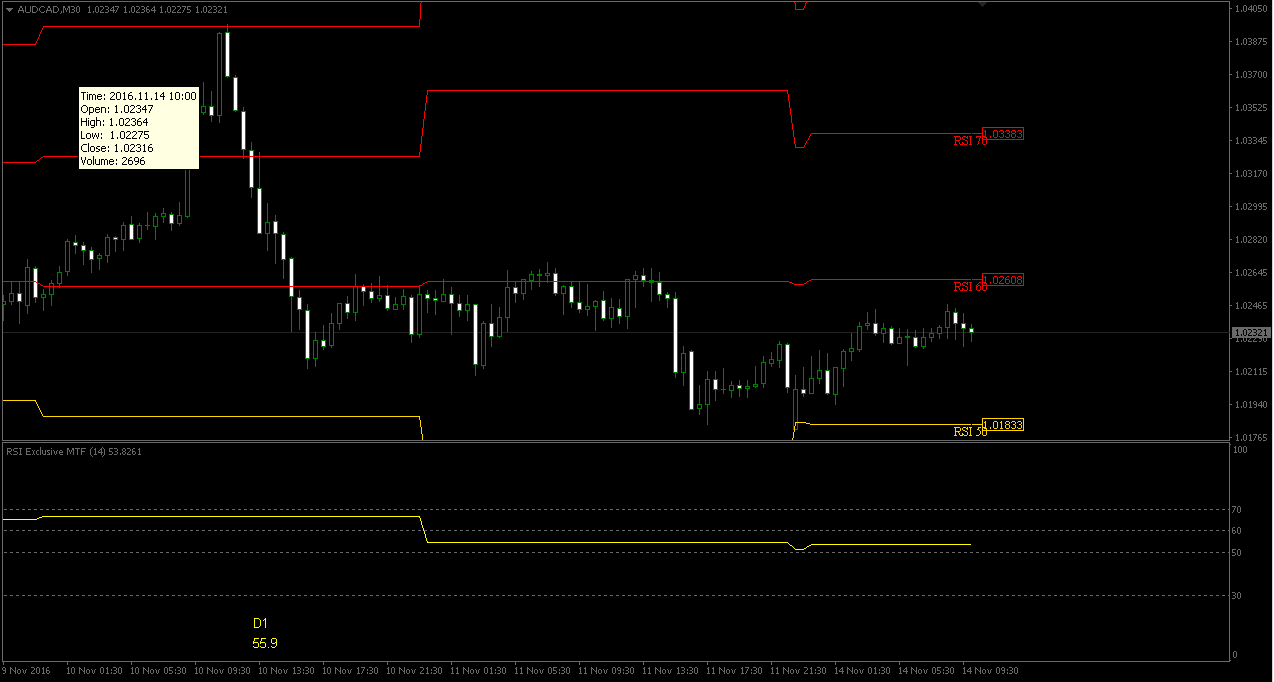
It is hard-coded to be multi time frame. You have to compare it to daily rsi
Ah ok I understood maybe. With RSI MTF it's clear right?
- Free trading apps
- Over 8,000 signals for copying
- Economic news for exploring financial markets
You agree to website policy and terms of use
Waddah Attar RSI Level:
Author: waddah attar