Color getting overlapped in the indicator
I am trying to paint the portions of the graph with Bollinger Bands. But while coloring the graph bands some portions are appearing to be colored with 2 colors or overlapped with colors,
See the following image:
See the portion marked with yellow rectangle. Kindly, let me know what I can do to avoid such overlapping for the colors.

- 2015.03.05
- Vladimir Karputov
- www.mql5.com
This is normal behaviour. See this article :
How I can avoid this overlap? As it is making the visibility unable to understand what color s present at the moment. Please help me. The documentation is not helpful right now.+
I am just using the following :
//--- plot Label1
#property indicator_label1  "UpTrend"
#property indicator_type1   DRAW_FILLING
#property indicator_color1  DarkGreen//C'10,10,70'
#property indicator_style1  STYLE_SOLID
#property indicator_width1  1
//--- plot Label2
#property indicator_label2  "DnTrend"
#property indicator_type2   DRAW_FILLING
#property indicator_color2  C'70,10,10'
#property indicator_style2  STYLE_SOLID
#property indicator_width2  1
//--- plot Label3
#property indicator_label3  "Flat"
#property indicator_type3   DRAW_FILLING
#property indicator_color3  Aqua//C'50,50,50'
#property indicator_style3  STYLE_SOLID
#property indicator_width3  1
I hope you can help me.
How I can avoid this overlap? As it is making the visibility unable to understand what color s present at the moment. Please help me. The documentation is not helpful right now.+
I am just using the following :
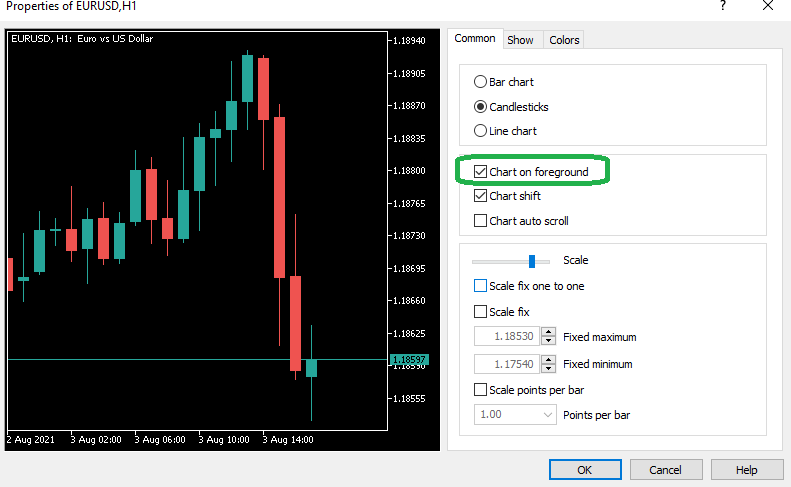
I hope you can help me.I have encountered similar issue. Apparently the quick fix is to turn on "Chart on foreground" under the Chart Properties.
- Free trading apps
- Over 8,000 signals for copying
- Economic news for exploring financial markets
You agree to website policy and terms of use
I am trying to paint the portions of the graph with Bollinger Bands. But while coloring the graph bands some portions are appearing to be colored with 2 colors or overlapped with colors,
See the following image:
See the portion marked with yellow rectangle. Kindly, let me know what I can do to avoid such overlapping for the colors.