Several years have passed since the publication of this model. It is possible to retrospectively analyse how this system would have worked on the market with the initial parameters.

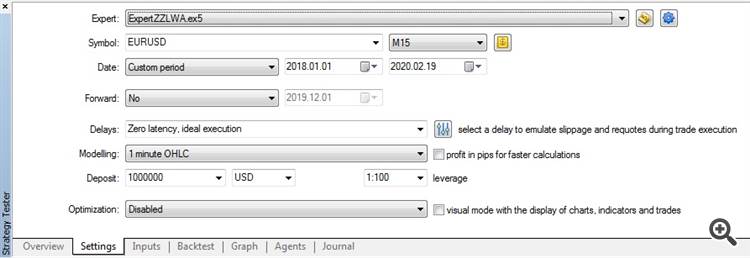
In fact, this system was ready at the end of 2016, but we could not get to the publication. I mentioned this for the sake of completeness. We will start from the actual date of publication. Let's test this period when the system showed steady growth.
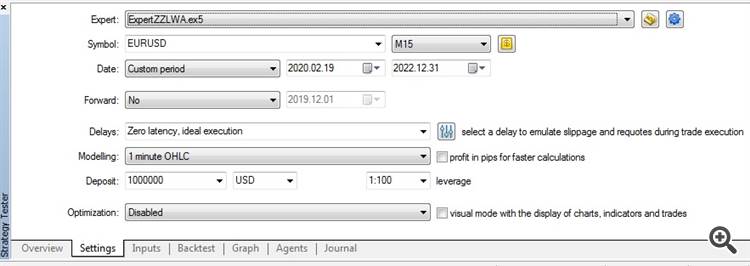
The system looks stable, so what can happen in the near future where it starts an unstoppable fall. Let's examine this period:
The result is discouraging. On a long test, this section is draining and avalanche-like. I found three possible explanations for this phenomenon:
1. There were fundamental changes on the market.
This version, in my opinion, does not stand up to criticism because of the change in the mutual position of equity and balance lines at unchanged stop loss and take profit ratios.

2. The quality of historical data is not good enough.
As we can see, this is an indisputable fact. But the degree of influence on the result is the subject of further research.
3. Some buffer overflow occurred.
In my opinion, this is indicated by the different result obtained when testing on the long section 2017.01.01-2022.12.31 and on the short loss-making section 2020.02.19-2022.12.31, given that the historical data are the same.
It seems to be most correct to add up the income for the periods where presumably there was no buffer overflow:
2849,07 + 425,20 = 3274,27
But this is not the point. The most important thing is that this system continues to show profitability for five years since its development.
Several years have passed since the publication of this model. It is possible to conduct a retrospective analysis of how this system worked on the market with the initial parameters.
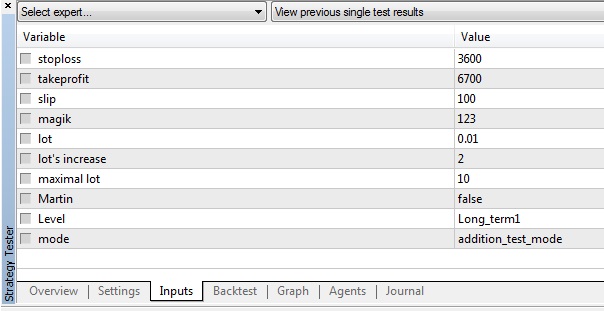
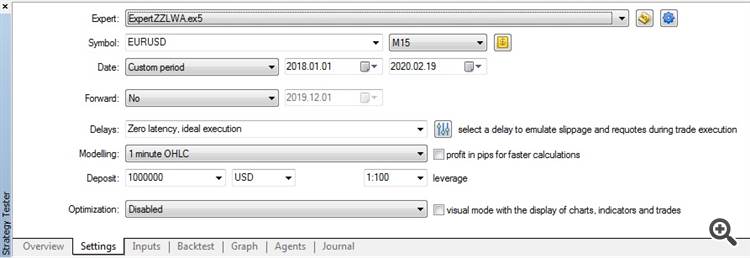
In fact, this system had been ready at the end of 2016, but I did not publish it until the end of 2017. I mentioned this for completeness. We will start from the actual publication date. Let's test this period when the system showed steady growth.
The system looks stable, what can happen in the near future where it starts to fall uncontrollably. Let's explore this period:
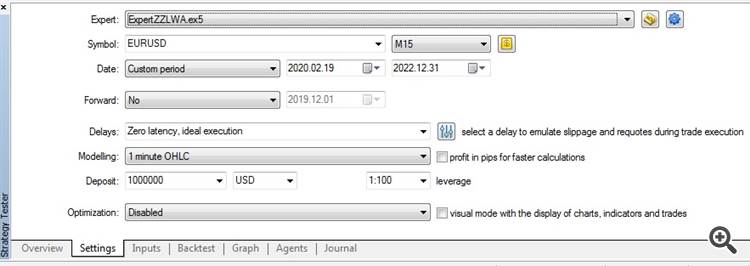
The result is discouraging. On a long test, this area falls like an avalanche. I found three possible explanations for this phenomenon:
1. There have been fundamental changes in the market.
This version, in my opinion, does not stand up to criticism due to the change in the relative position of the equity and balance lines with unchanged stop loss and take profit ratios.
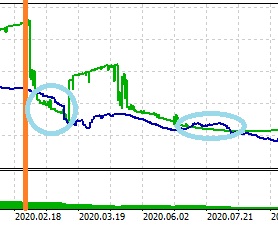
2. Insufficiently good quality of historical data.
As you can see, this is an indisputable fact. But the degree of influence on the result is a subject for further research.
3. A buffer overflow has occurred. In my opinion, this is indicated by the different results obtained when testing on the long section 2017.01.01-2022.12.31 and on the short unprofitable section 2020.02.19-2022.12.31, given that the historical data are the same.
It would seem most correct to add up revenues for periods where no buffer overflow was supposed to occur:
2849.07 + 425.20 = 3274.27
But that's not the point. The most important thing is that this system continues to show profitability for five years from the moment of its development.
- Free trading apps
- Over 8,000 signals for copying
- Economic news for exploring financial markets
You agree to website policy and terms of use










ExpertZZLWA:
The Expert Advisor allows checking the potential profitability of the ZigZagLW Addition indicator.
Author: Gayrat Madumarov