Indicators: Symbol Movement
Can u make it as Fibonacci percent...?
that is minus, zero, plus %
rajancr:
Can u make it as Fibonacci percent...?
that is minus, zero, plus %
Probably. I have plan with Fibonacci Retracement.
joglekarr:
Hi
This indicator is not working at all
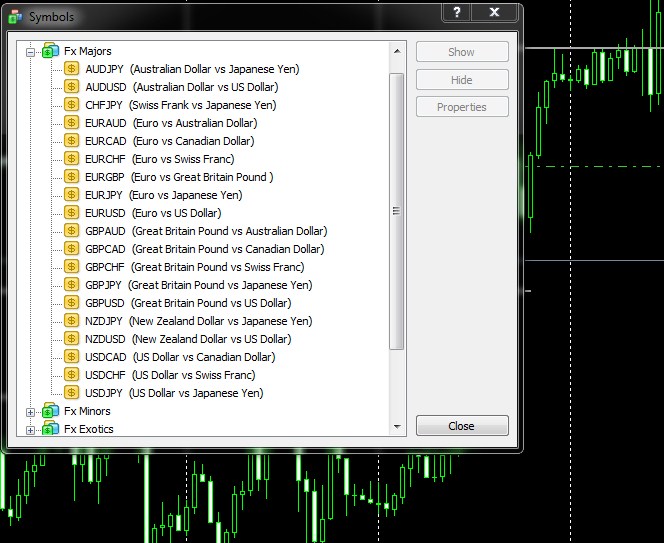
Does your broker has currency pairs for trading? And all currency pairs are enabled for trading? Go to "Market Watch" -->> Right Click on it -->> Click "Symbols" -->> Now Enable All Currency Pairs.
Files:
Screenshot_1.jpg
98 kb
Hello,
could you please explain what exactly the numbers are meaning in the parenthesis.
Is this a percent value, or pip?
You are missing trading opportunities:
- Free trading apps
- Over 8,000 signals for copying
- Economic news for exploring financial markets
Registration
Log in
You agree to website policy and terms of use
If you do not have an account, please register
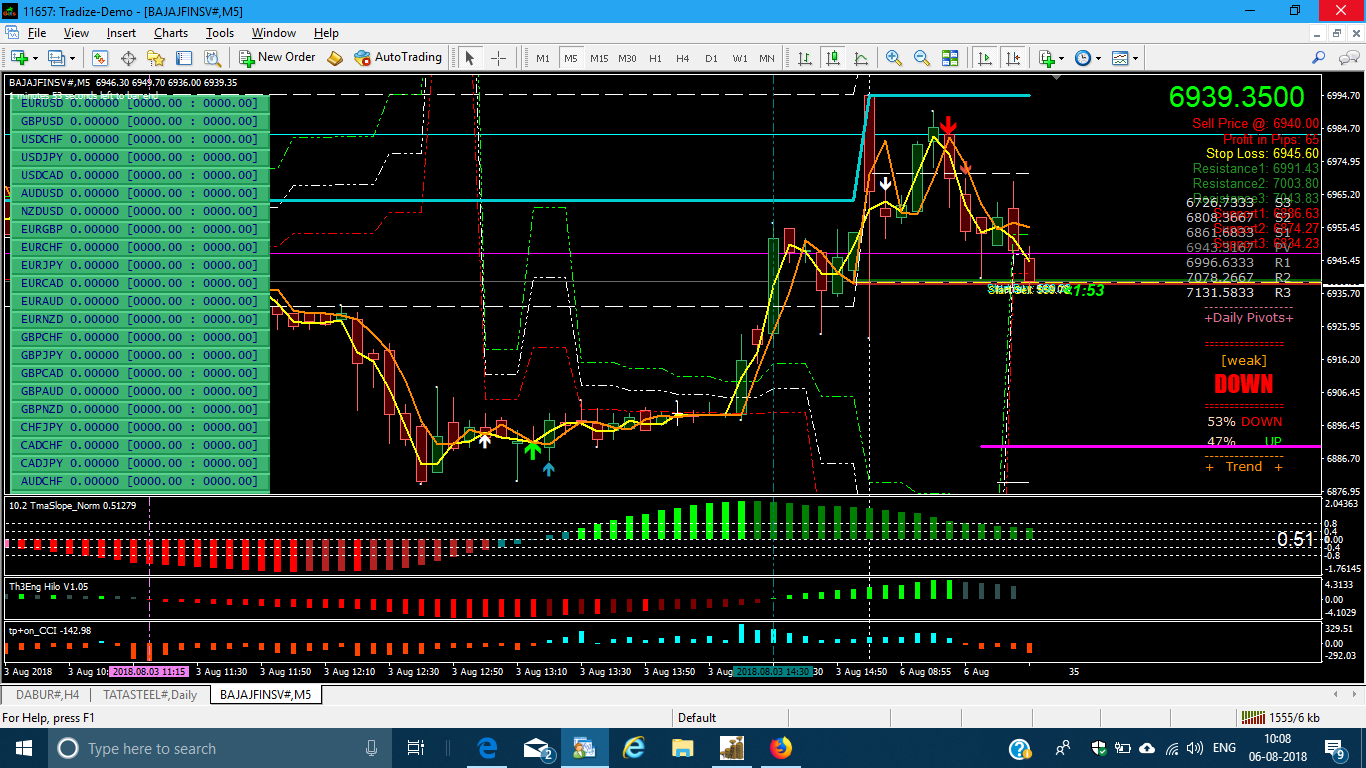
Symbol Movement:
This custom indicator will show you 28 pair's daily candle range, High-Low range, candle bullishness or bearishness from real tick market. So you can understand the overall market situation very short time. You can change the default timeframe from Daily to any period and default candle (bar) number from 0 to any previous number. Also you can open the required symbol by clicking the symbol button.
To understand the indicator's activity, please see the attached image:
Author: Tanvir Ahmed