Forum on trading, automated trading systems and testing trading strategies
newdigital, 2014.02.27 05:22
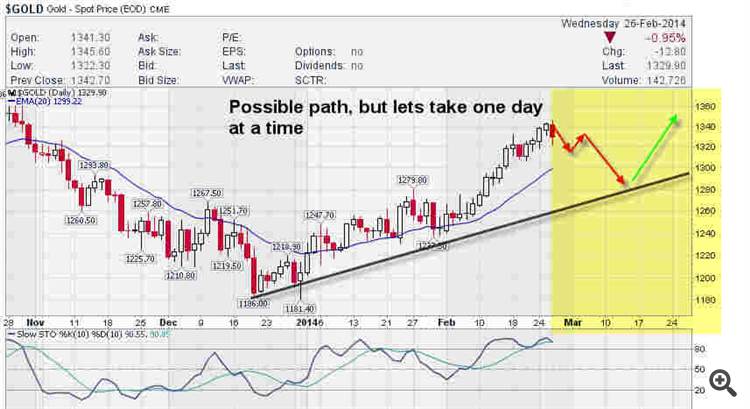
Gold Due for Pullback Wave 2? (based on thetechnicaltraders article)
A pullback in Gold today to 1320’s from the 1348 high. We had been
looking at about 1350 plus minus as an initial objective off the 1181
pivot lows for the truncated 5th wave of the bear cycle. We can see
support at $1300 for spot Gold right now in the charts in terms of
keeping it simple.
Now lets keep in mind we just rallied from 1181 to 1348, or about 167
points which is quite a rally. Indeed, February is often a short term
cycle low for Gold and has been in years past.
A normal corrective wave 2 would be anywhere from 38% on the low end to 61% on the higher end as likely.
Using some basic math, 38% of 167 points is $64 an ounce, giving* a possible pivot target of $1284 plus minus a few.
So bottom line? We remain bullish long term, short term we may have a
minor wave 2 pullback to work off some of this 167 dollar rally in Gold,
and 1284 is a 38% fib pivot and 1300 is traditional support.
May just need to take a rest here for a bit… otherwise we maintain for now our $1550 target for 2014.
- Free trading apps
- Over 8,000 signals for copying
- Economic news for exploring financial markets
You agree to website policy and terms of use


Daily analysis (GOLD)
In the view of day candle gold has formed higher than higher and continues higher low the price is expected to find resistance around 1350 where price dropped to 1182 If price break up and close with body above 1350 gold can move higher If price struggling to break up around 1350 it is advised to wait and watch for the further action. Stochastic and RSI is at Overbought so waiting for good retrace and find support around 1300 will sound good to place buy orders as trend is bullish