How to make profit with ADVERS?S TACTICS
http://i63.tinypic.com/2dkb7t5.png"]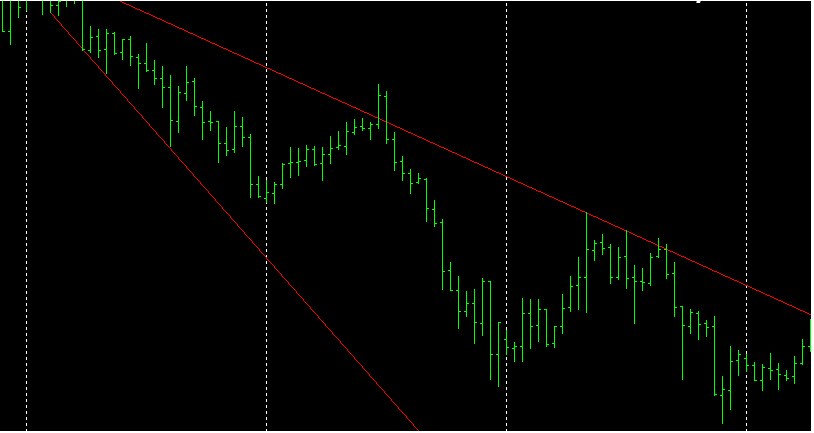
Here is a pictorial illustration of the whole idea of the Advers's Tactics strategy and when to enter the market.Firstly point out the local peak and assuming there will be a change in the trend direction place the number 1.Sometime later when the prices continue the movement in this case , search for a new local minimum or maximum or there was a correction and the price gave one more peak lower.This is the beginning of the weep, place the numbers 2 and 3 subsequently draw one line and wait for a rollback if it doesn't happen search again for the new maximum or minimum .If a rollback occurs place the number 4 and draw the second line . Now you have the price channel and can assume the price would move within that channel.
EURJPY signal based on Advers's Tactics active
Buy Order
Pair: EURJPY
Take Profit: 118.18
Stop Loss: 117.18
EURUSD signal based on the fifth measurement Strategy active
Buy Order
Pair: EURUSD
Take Profit: 1.1144
Stop Loss: 1.1864
EURUSD signal based on the fifth measurement Strategy active Sell Order Pair: EURUSD Take Profit: 1.1144 Stop Loss: 1.1864
GBPCHF signal based on the Advers Tactics Strategy active
Sell Order
Pair: GBPCHF
Take Profit: 1.2888
Stop Loss: 1.3018
USDCAD signal based on the Advers Tactics Strategy active
Sell Order
Pair: USDCAD
Take Profit:1.3082
Stop Loss: 1.2972
USDCAD signal based on the Advers Tactics Strategy active now.
Buy Order
Pair: USDCAD
Take Profit: 1.3098
Stop Loss: 1.3018
USDJPY signal based on the Advers Tactics Strategy active now.
Sell Order
Pair: USDJPY
Take Profit: 106.12
Stop Loss: 106.92
USDCAD signal based on the Advers Tactics Strategy active now.
Sell Order
Pair: USDCAD
Take Profit: 1.3202
Stop Loss: 1.3252
- Free trading apps
- Over 8,000 signals for copying
- Economic news for exploring financial markets
You agree to website policy and terms of use
In today's article we would take a look at adverse tactics, this strategy isn't recommended for new traders. To apply this system, see the step by step video here
The idea of the system is to draw lines which would become the boarders of movement in the future. It happens as follows;
First we point out the local peak and assume there will be a change in the trend direction and we place the number 1.Sometime later the prices continue the movement in this case ,we search for a new local minimum or maximum or there was a correction and the price gave one more peak lower.
This is the beginning of the weep, we place the numbers 2 and 3 subsequently we draw one line and wait for a rollback if it doesn't happen we search again for the new maximum or minimum .If a rollback occurs we can place the number 4 and draw the second line .
Now we have the price channel and can assume the price would move within that channel. Accordingly we have support and resistance lines, if you become a professional in the use of the system you can achieve very good results in trading however the system isn't recommended for beginners because of the complexity of the construction and the high psychological stress.
Happy Trading!