bar chart
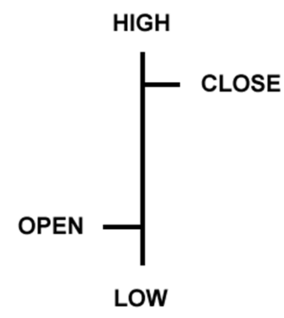
Bar charts are also called “OHLC” charts as the thread starter stated , they indicate the Open, the High, the Low, and the Close for that particular currency. An example of a bar chart is bel
Most traders prefer Candlesticks since they are easy to use and interpret. Another relevant point to note is that they are good at identifying market turning points (reversals from an uptrend to a downtrend or a downtrend to an uptrend)
Files:
You are missing trading opportunities:
- Free trading apps
- Over 8,000 signals for copying
- Economic news for exploring financial markets
Registration
Log in
You agree to website policy and terms of use
If you do not have an account, please register
A type of chart which consists of four significant points: the high and the low prices, which form the vertical bar, the opening price, which is marked with a little horizontal line to the left of the bar and the closing price, which is marked with a little horizontal line to the right of the bar.