lets define a trend..quantitatively
I would like to ask you, how you would define a trend in your opinion? but not with letters but as an ea.
what is more important to you, the time component(for how long the price has been reaching new highs/lows) or the quantity(for example 300 pips in one day or 3000)???

The daily Euro/USD, we had a good few months of trending, are you asking how we could supply,interpret this for a EA to recognize ? good question, as Talon has expressed, there are all forms of trends on different time frames, you would need different criteria for each one, the daily shows a good steady rise with some great spikes, a little bit erratic at the start but conforming as it rises, a trailing stop would have probably been triggered somewhere at the first spike,loosing the best part of the trend, maybe the best place to follow would be the line underneath the whole trend, now this would be a great idea.
In my opinion and looking at the chart, my rules would be to open the trade as the green bar forms, let the price move on and at sometime move the stop to the price opened and let it run, this way you are trading at no risk, if in this instance we had implemented these rules we would have been sitting pretty, hindsight is a wonderful thing and I can only make these observations after the event.
To see trending, I think , we should open many charts with many different timeframe
I would like to ask you, how you would define a trend in your opinion? but not with letters but as an ea.
what is more important to you, the time component(for how long the price has been reaching new highs/lows) or the quantity(for example 300 pips in one day or 3000)???
I have posted a few snapshots below of different time frames and how development occurs, with hindsight, Talon has pointed out a classic, note the long green candles and how the price never penetrates the open but continues to break the high.
So now we can go backward to see how this performed on the 1HR chart and would or could we have deduced a trend.
h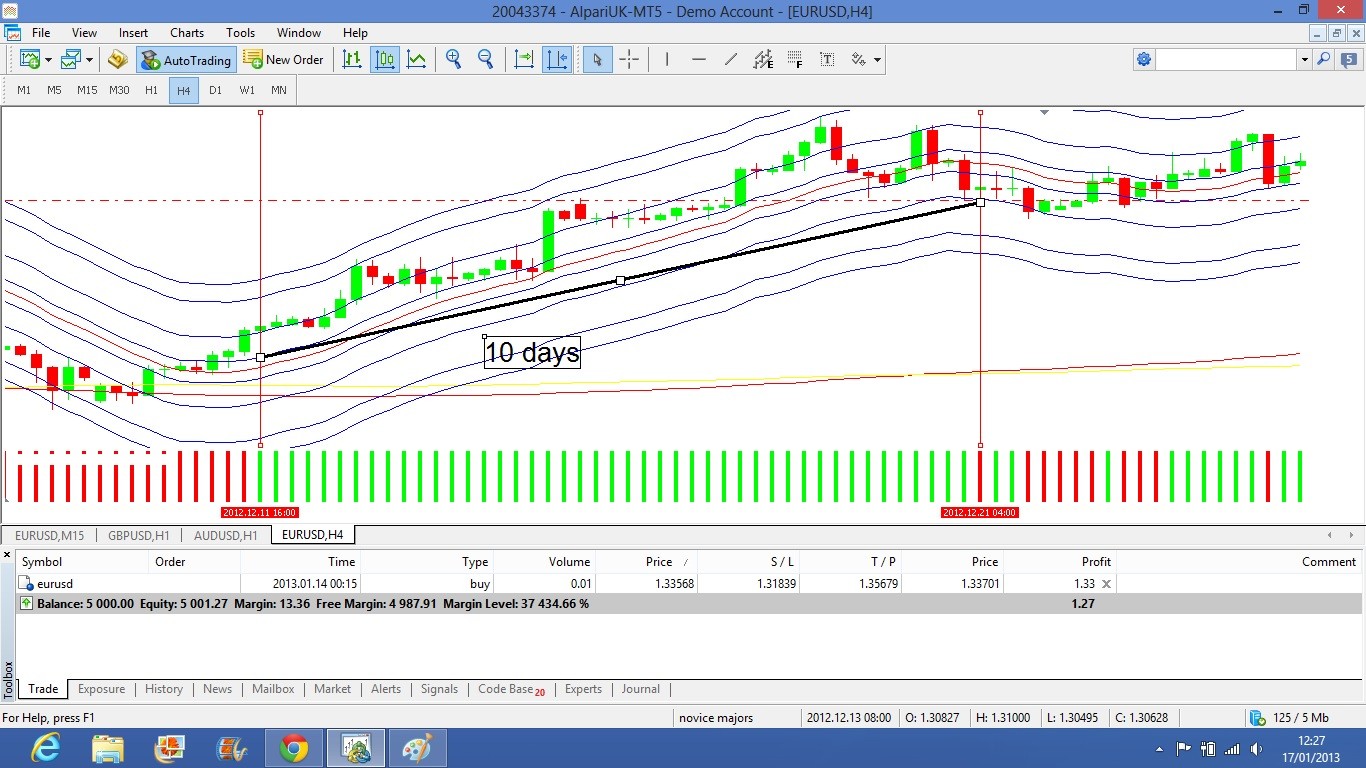
The 1HR chart shows a rise in price but not as straight forward as the 4HR

The 30 min chart, again nothing that stands out other than the rise in price

The last chart was going to be the 15min but I could not see the point as there nothing more to see other than the price rising and a little distortment along the way, the point I'm making, maybe to quantify the trend we may have to start with a greatly higher time frame otherwise we can only see chaos on the smaller time frames, in the instances above we are clear there is a trend however this is after the event but strip out the 1&4hr chart, could you deduce a trend that would last ten days, possibly the approach would be from a position management view, as the price moves into profit, you move the stop-loss to the open position, you could aslo reduce the position size as the market "notches" up, just a thought.
This concept of higher time-frames I read about, "bird watching in lion country" no publicity intended, in the book there was a great story of how 3 blind men described what they were touching, it was strange that they were all touching an "elephant" but each one had a different description of what this was, they could only interpret what they thought they could "see", a chart and all information, to each individual is viewed very differently
- Free trading apps
- Over 8,000 signals for copying
- Economic news for exploring financial markets
You agree to website policy and terms of use
I would like to ask you, how you would define a trend in your opinion? but not with letters but as an ea.
what is more important to you, the time component(for how long the price has been reaching new highs/lows) or the quantity(for example 300 pips in one day or 3000)???