Updated Intraday technical analysis for major currencies
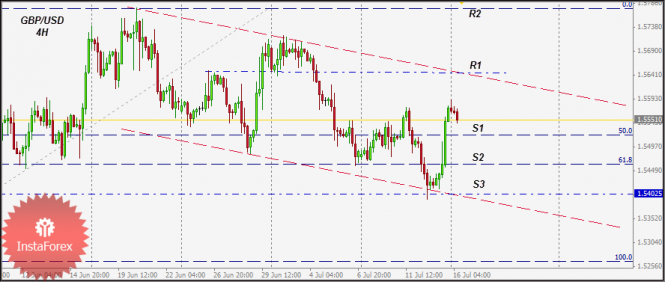
Using the Linear regression channels on the GBP/USD 4H chart, we see the following:
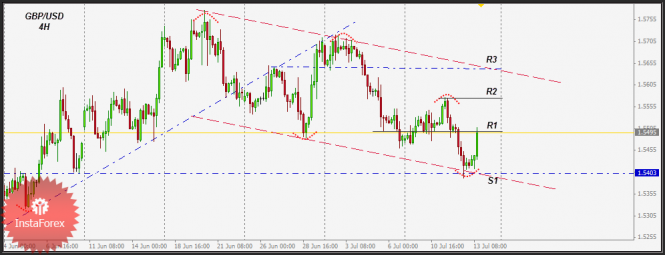
- The GBP/USD currency pair found resistance around 1.5875 which corresponds to the upper limit of both drawn channels.
- The pair has successfully broken the intermediate line of the bullish channel at 1.5800.
- The pair is probably forming a Head and Shoulders reversal pattern which is marked on the chart.
These factors highly suggest that the pair is BEARISH. However, It has a considerable support at 1.5720 which corresponds to the lower limit of the bullish channel & the intermediate line of the longer-term bearish channel where price action should be watched.
Break of the mentioned support will open the way down to the lower limit of the bearish channel around 1.5585.
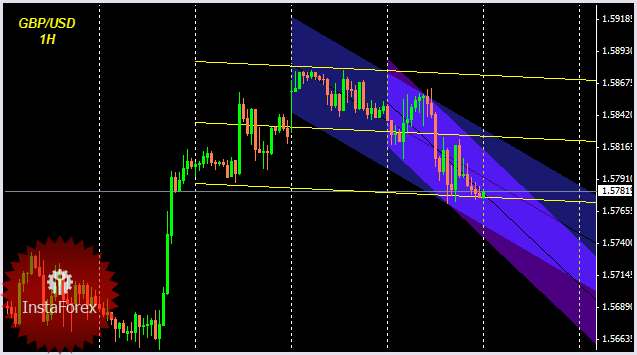
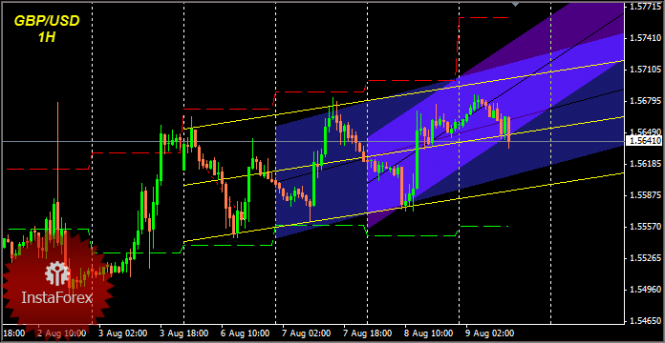
On the Hourly chart, the pair is testing the lower limit of the yellow channel which is also a daily low at 1.5771.
Break of this support will allow the pair to resume its mentioned scenario on the 4H chart. However, reverse of this support level at 1.5771 will push the pair to test 1.5825 which is considered a better opportunity to go short on the pair.
Price level 1.5825 corresponds to the upper limits of both violet and blue channels & the intermediate line of the yellow channel.
The whole scenario will be invalid if the GBP/USD pair breaks the recorded high at 1.5927.
Show full picture
Using the Linear regression channels on the GBP/USD 4H chart, we see the following:
- The GBP/USD currency pair found resistance around 1.5875 which corresponds to the upper limit of both drawn channels.
- The pair has successfully broken the intermediate line of the bullish channel at 1.5800.
- The pair is probably forming a Head and Shoulders reversal pattern which is marked on the chart.
These factors highly suggest that the pair is BEARISH. However, It has a considerable support at 1.5720 which corresponds to the lower limit of the bullish channel & the intermediate line of the longer-term bearish channel where price action should be watched.
Break of the mentioned support will open the way down to the lower limit of the bearish channel around 1.5585.
Show full picture
On the Hourly chart, the pair is testing the lower limit of the yellow channel which is also a daily low at 1.5771.
Break of this support will allow the pair to resume its mentioned scenario on the 4H chart. However, reverse of this support level at 1.5771 will push the pair to test 1.5825 which is considered a better opportunity to go short on the pair.
Price level 1.5825 corresponds to the upper limits of both violet and blue channels & the intermediate line of the yellow channel.
The whole scenario will be invalid if the GBP/USD pair breaks the recorded high at 1.5927.
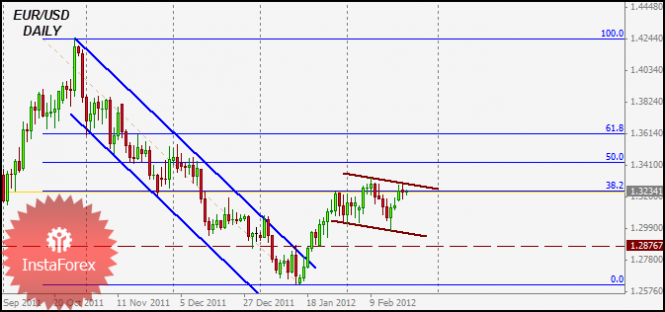
Having a massive swing to the downside between 1.4245 - 1.2622, EUR/USD currency pair is now testing 38.2% Fibonacci level at 1.3237.
Previous visits to this resistance level took place this month with obvious bearish reaction with a possible Head & Shoulders reversal pattern in progress.
Also the pair is testing the upper limit of the drawn sideway channel around the same price level.
Reversal of the upper limit of the channel will push the pair to test the lower limit around 1.2970. However its obvious break will make the forming pattern more likely a Flag continuation pattern.
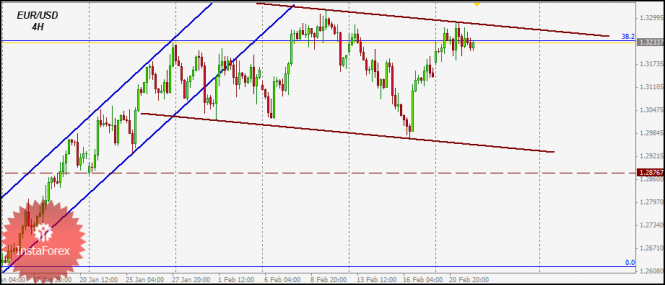
The EUR/USD is showing obvious bearish reaction towards 38.2% Fibonacci level & the upper limit of the drawn channel.
This enhances the bearish view as long as the pair is unable to step above 1.3322.
Price level 1.3240 is considered a good intraday resistance which should keep price trading below it if the bears are strong enough to initiate a push to the downside today.
Break & Fixation above 1.3325 invalidates the bearish scenario for the time.

GBP/USD Survey according to the Linear Regression Channels over the past two weeks:
- After failure to trade below 1.5800 yesterday, GBP/USD pair is now testing 1.5925 which is corresponding to the upper limit of the bullish blue channel.
- GBP/USD respected the upper limit of both channels depicted on the chart which showed bearish presence pushing the pair down to 1.5802. However, Price came back quickly to break this channel with quite strong bullish 4H candlestick.
- GBP/USD is now testing the high for this month at 1.5927. Moreover, it has a strong resistance area at 1.5940-1.5960.
- Broken limit of the violet channel at 1.5850 is now acting as support level for the pair.
4H closure above 1.5960 allows the pair to reach 1.6050.
The 1H chart of GBP/USD shows that the pair has an important support level at 1.5900 which is the lower limit of the violet bullish channel, the intermediate line of the Yellow one and the upper limit of the transverse blue channel.
This price level 1.5900 is significant as Bullish Price Action towards it pushes the pair to the upside reaching 1.5950 initially.
Break of this level will allow the pair to reach 1.5850 which is corresponding to the lower limit of the Yellow bullish channel which constitutes an important support for the pair today.
Today we should be cautious as channels are quite wide indicating a possible strong movement whatever the direction is.
-GBP/USD is trying to bypass resistance area 1.5940-1.5960 for the second time this week & seems to be failing in that.
This will probably delay further bullish movement and push the pair down to 1.5860-1.5840.
4H closure above 1.5960 allows the pair to reach 1.6050.
- Broken limit of the violet channel at 1.5850 is now acting as support level for the pair.
The pair is failing to make higher highs after it made bullish breakout which is an early warning of bullish weakness at the current time.
As expected, visiting support level 1.5900 pushed the GBP/USD currency pair to the upside towards 1.5960 Yesterday.
The pair is failing to maintain its uptrend withing the violet channel trying to make a bearish breakout in the current time.
Area 1.5925-1.5900 which corresponds to the lower limit of both violet & yellow channels should be defended by bulls. Otherwise, GBP/USD may witness a quick decline towards 1.5850.
Price Level 1.5850 is an important support on the 4H chart where price action should be watched for a possible Long entry.
We should pay attention as the 1H chart shows bullish weakness unlike the 4H chart which is still bullish as long as the pair is trading above 1.5850.
This week USD/CAD showed massive bearish reaction towards resistance area 1.0040-1.0060 manifested in the "Inverted Hammer" daily candlestick.
This resistance area which was able to keep USD/CAD prices below it for almost one month despite the several trials to break it, also corresponds to the downtrend line and the upper limit of the transverse channel depicted on the chart.
This Week, USD/CAD could successfully break its intraday support at 0.9940 which allowed the current decline of currency price to happen.
The USD/CAD pair has an intraday support at 0.9850 which was mentioned in the previous two days as a first bearish target after break of 0.9940.
We need to see 4H closure below 0.9850 in order to resume the bearish movement.
Yesterday we had another daily closure below 0.9920 which gives more confirmation of the direction towards 0.9770. However, 4H closure above 0.9990 gives warning for sellers to get out of the short positions.
Based on the previous analysis
For swing traders, We have an open short position with TP at 0.9770 then 0.9660.
For Intraday traders, To minimize risk, selling the USD/CAD pair near 0.9940 will be appropriate with SL placed above 0.9990.
Last week, GBP/USD currency pair could bypass resistance level 1.5870 without obvious bullish follow up with manifestations of weakness of bulls that appeared on testing supply zone 1.5940-1.5960.
Last Friday daily candlestick came bearish engulfing one that closed way below 1.5840 which is an intraday support for the pair which is another bearish indication.
The GBP/USD has a support area between 1.5740-1.5760 which corresponds to the lower limit of the depicted bullish channel & previous mutliple tops which is the key-level for bulls this week.
Direct testing of this support area will probably bring bullish strength again towards 1.5870 which is the key level for bears.
As mentioned on Friday, Failing to break 1.5940-1.5960 allowed a quick decline towards 1.5840 to happen.
On the 4H chart, There's a possible "Head & Shoulders" reversal pattern being formed which gives a good SELL entry around 1.5870 corresponding to the right shoulder.
Also the GBP/USD pair is approaching the lower limit of the bullish channel at 1.5740-1.5760 which constitutes an intraday support for the pair if visited first.
Break of of this support will initially lead to a decline towards 1.5660 the prominent support on the 4H chart.
Break and stabilization above1.5960 invalidates the bearish scenario.

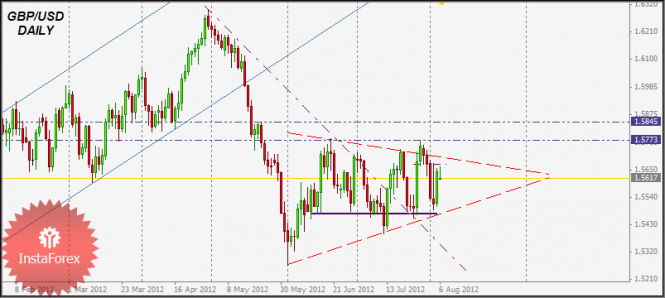
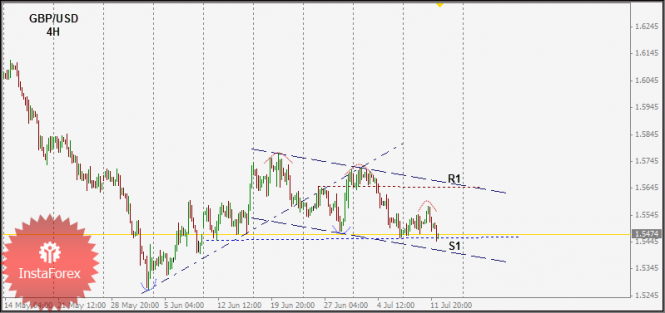
On the mid-term scale, the GBP/USD currency pair is moving sideways in a slightly bearish channel since it managed to breakdown the mid-term uptrend line depicted on the chart.
Price levels of 1.5460 & 1.5520 which correspond to 61.8% & 50% Fibonacci levels based on the previous bullish swing 1.5266 up to 1.5774.
On the Intraday scale the price zone of 1.5420 – 1.5450 corresponds to the lower limit of the long-term channel which constitutes a very strong support zone and is likely to push the GBP/USD pair to the upside to 1.5580 then 1.5645 with SL located below 1.5400
A short-term Head & Shoulders reversal pattern was expressed yesterday at the key-zone of 1.5460 – 1.5520 which was confirmed yesterday. However, the GBP/USD failed to make higher highs. Instead, it’s building bearish pressure over the support level of 1.545
The pair is probably forming a mid-term bearish Head & Shoulders reversal pattern with its right shoulder located around R1 (1.5645) which is rendered a valid Sell entry with SL located above 1.5725.
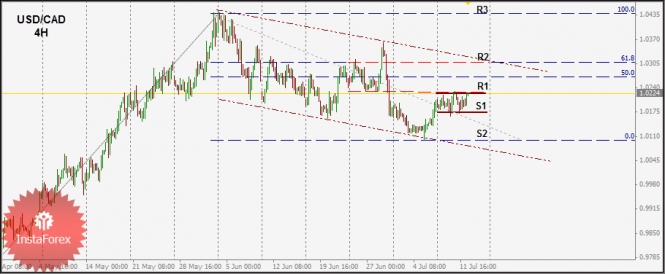
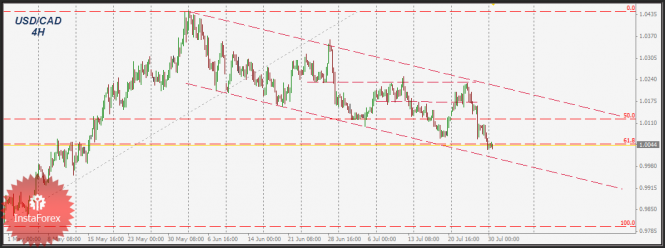
The USD/CAD pair is expressing a continuation of the Flag Pattern after the long bullish swing initiated around the price level of 0.9797 on the 1st of May which is expected to reach the target of 1.0360 then 1.0450 as initial targets for the pattern when it is confirmed by breakthrough above 1.0310 (61.8% Fibonacci Level).
Since June 4 the USD/CAD pair movement is maintained within the mid-term slightly bearish depicted channel with its upper limit located around 1.0300.
Fibonacci level 50% & 61.8% are located at Price levels of 1.0270 & 1.0310 respectively which are considered as strong Resistance levels for USD/CAD that need to be broken in order to confirm the Flag Pattern mentioned above.
Since Yesterday, the USD/CAD has been trapped within a narrow-ranged price zone between 1.0160-1.0230 which needs to be broken 1st in order to determine the next termination of the pair.
On the short-term Price level of 1.0160 constitutes a strong Intraday Support which is expected to push USD/CAD to the upside towards 1.0200 then 1.0270 with SL below 1.0090.
Price zone between 1.0270-1.0290 should be carefully watched for price action in order to take a profitable trade at this key level.
On the mid-term scale, the GBP/USD currency pair is moving sideways in a slightly bearish channel since it managed to breakdown the mid-term uptrend line depicted on the chart.
Price levels of 1.5460 & 1.5520 which correspond to 61.8% & 50% Fibonacci levels based on the previous bullish swing 1.5266 up to 1.5774.
On the Intraday scale the price zone of 1.5400 corresponds to the lower limit of the long-term channel which constitutes a very strong support zone and is likely to push the GBP/USD pair to the upside to 1.5520, 1.5570 then 1.5640 with SL located below 1.5390.
A short-term Head & Shoulders reversal pattern was expressed this week at the key-zone of 1.5460 – 1.5520 which was broken down yesterday. However, the GBP/USD failed to make higher highs. Instead, it’s building bearish pressure over the support level of 1.540
The pair is probably forming a mid-term bearish Head & Shoulders reversal pattern with its right shoulder located around R1 (1.5645) which is rendered a valid Sell entry with SL located above 1.5725.
The current price level 1.5500 constitutes a strong Intraday Resistance for the GBP/USD which should be watched for price action today as its breakthrough will open the way towards the next Resistance at 1.5570 then at 1.5640.
If you like my articles, please vote for me in Analyst of the Year Contest by clicking here.
- Free trading apps
- Over 8,000 signals for copying
- Economic news for exploring financial markets
You agree to website policy and terms of use
Hello,
I'm Mohamed Samy
Technical analyst at Instaforex company.
I would like to share my intraday technical analysis articles on a daily basis
Most likely there will be GBP/USD & USD/CAD currency pairs articles every day.
Thank You.
To be followed.