Price Action Trading
I want to define what price action means: price action means to forecast future forex price movements based on examination of past and current price movements. Basically it’s pattern recognition and assigning a probability of success.
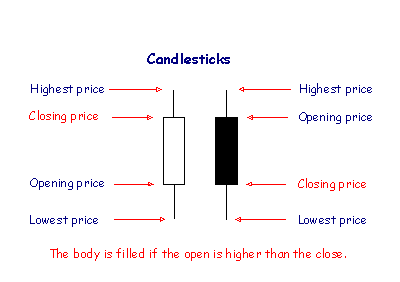
I like to view PA by using candlestick charting. Some traders use bar charts, line charts, etc…I find that candlesticks provide a good visual picture of what’s going with price. See belo
I look forward to this - I've just started looking more closely at PA rather than indicators and another point of view will be very welcome
it's better to understand what's trend anyway so you can see where the price will move
I want to review some of my favorite candlestick formations. Don’t worry I’m not going to list 30 patterns with hard names to remember. I like to keep things simple and I’ll be discussing only 3 patterns. The rest will be covered in the discussion of single bar supply/demand analys
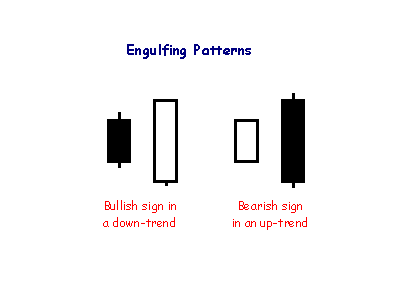
The first candlestick formation that I like is the Engulfing Pattern or sometimes called outside bar. This is when price moves higher than the previous price bar only to reverse and break the low of the previous price bar. This example would be a bearish sign and vice versa for a bullish sign. The reason I like this candlestick formation is because most of the time it represents a price reversal.
The second candlestick formation is the Inside Bar pattern. This is when the current price bar high and low is with in the previous bar high/low range. This formation represents a pause in price action and will lead to a break in price. I usually only trading the break if it’s in the same direction of the trend
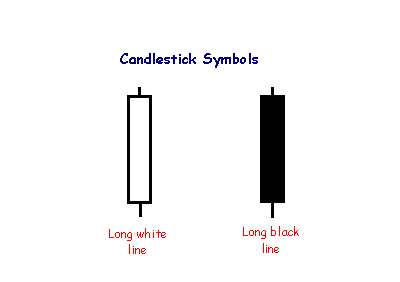
The last candlestick formation is the Long Bar. This is when price moves nicely from the previous bar close and closes near the low or high of the bar. This bar represents that there are aggressive buyers or sellers. Most likely price will continue in the direction of the long bar.
I look forward to this - I've just started looking more closely at PA rather than indicators and another point of view will be very welcome
Ok, nice. I think you will find less is more with respect to indicators.
Most indicators lag, so it's a good practice to use price action, candlestick patterns or breakouts as one of the signals for the trading system.
this is my first post.. am eager to learn
Keep on with this good work!!!
- Free trading apps
- Over 8,000 signals for copying
- Economic news for exploring financial markets
You agree to website policy and terms of use
Hey All
This thread will be about how to trade forex by analyzing Price Action (PA). There will be NO indicators used except one that I will discuss later. Once you learn how to read PA your trading strategy will never become obsolete.
I’ll be starting off with basic concepts and then proceeding to additional topics which will include trade set-ups. The system is mainly a trend following system but does have some countertrend components to it.
Hope you enjoy the thread and I’ll be posting more a later