Williams %R Paper vs. EA Trading
Ok, so I just created an EA that alerts me when William's %R goes over -20 or under -80. Problem is the alert keeps going off every tick till the next candle opens. Can someone take a look at my code and point out what can be done?
I attached the EA.
nice profit but how can you get entry..it's not clear in the chart and indicators.
Nic
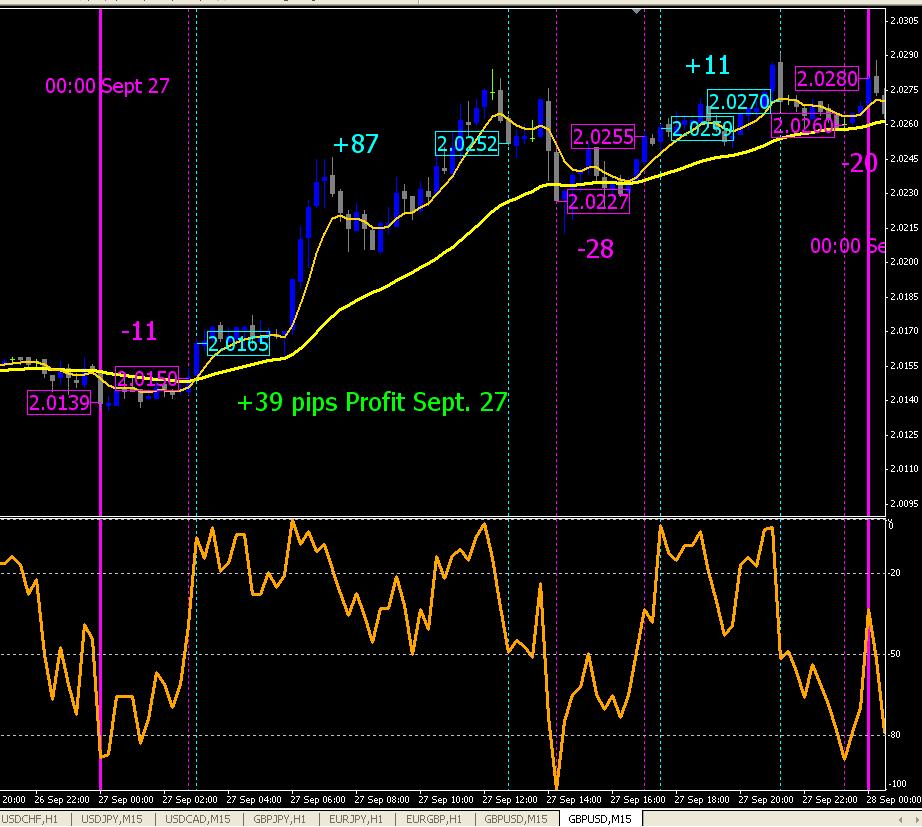
Magenta are short trades Aqua are long.
The vertical lines that intersect the indicator above -20 and below -80 are the entries. The vertical lines with matching color that cross the indicator at -50 are the exits.
You can also tell by looking at the price attached to each vertical bar and candle close. The magenta prices are short.
Looking at the images in the 1st post might make it a bit clearer too. They have arrows to mark entry and an X to mark exit. I didn't put the arrows on the indicator in the second set of images because it takes a long time.
I'm going to attempt to do the whole month of September like this. Hopefully it will give me a clearer picture of how and if the system works. I also just started on an excel doc that records the date/time entry price/exit price and P/L from Jan 1st and will take it up to the current date. Needless to say this will take some time. 
Hi there,
it would be very much helpful if any there is an alert on william's percentage r indicator.Been going through all the threads but with very much less luck.It would make my life easier if there is a sound alert at levels,,-20,-50,-80.
Thanks again guys.
Happy Trading
Cheers
nezitic
You can also add fractals to the chart and use it as TS. In a longer TF it makes alot of profit.
- Free trading apps
- Over 8,000 signals for copying
- Economic news for exploring financial markets
You agree to website policy and terms of use
Hi Everyone,
I would like to get some opinions about results with paper trading vs. trading with an EA and demo/live trading with my system.
I'm using a very simple system based off of the Williams %R indicator. Here ar the rules....
Williams %R using 14 period on 15min GBP/USD
Long = Open when Williams %R closes over -20, Exit when Williams %R closes at or below -50.
Short = Open when Williams %R closes under -80, Exit when Williams %R closes at or over -50.
Thats it! Now i have paper traded this system over the corse of 5 days and with 5 random date ranges. The market was trending during some of these test periods and flat during other and the results for the trending test periods were of corse very good. During flat they were decent and in profit.
I then used an EA i made with Expert Advisor Builder for MetaTrader 4
The results i had with the EA using the same dates i used when paper trading were not good at all. In flat markets it was a train wreck, and in trending the results were OK. It seems that the EA will sometime open and exit trades just as when i was paper trading but most of the time it would open later or not at all when based on the indicator it should have. The same was true with exits.
So I decided to try the system using a demo account. Since I work i only have from 7pm - 2am EST to watch the markets. The results I had matched up very very close to the results i had when i went back and paper traded the dates and times i was trading the demo account. I then used the EA and again the results were nasty.
The problem seems to be that the EA created by the EA builder just cant open trades at the time that it should, which is on the close of the candle over -20 or under -80. Same goes for the exit.
Is this true of all EAs? Or do I just have an EA thats junk?
I attached 4 jpg files that show 1 of the date ranges that i tested. Any ideas? Comments about the system?