Manhattan chart
As there was no replies over the week-end, i can only assume it is not possible on mt4. So, does anyone have any ideas on how I can draw numerous horizontal lines at highs and lows of a chart connected at swing change points by vertical lines. Any ideas welcome as I am struggling at the moment, trying to adapt the zig zag code.
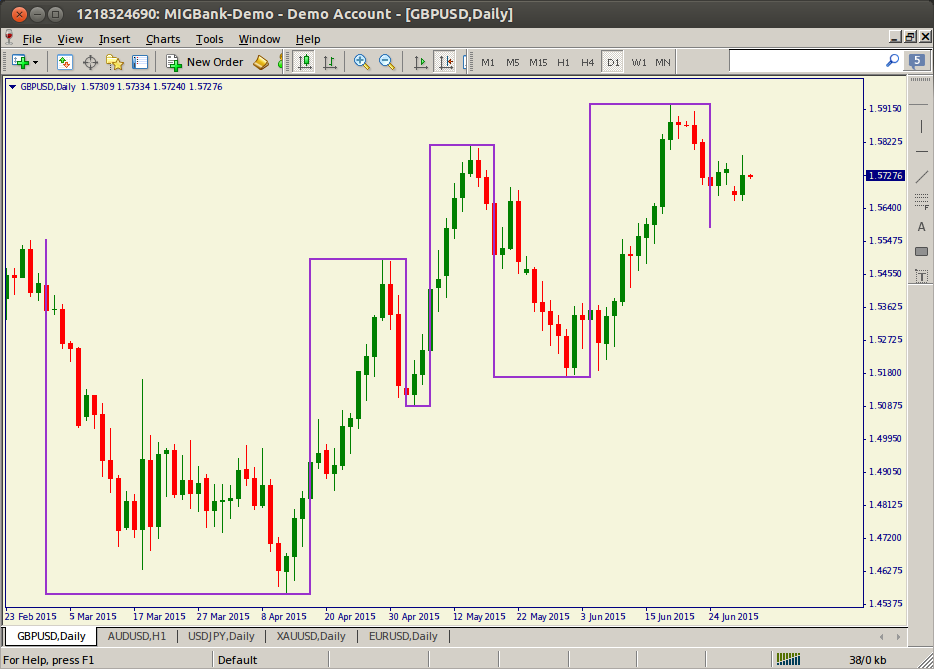
No, Its a gann style swing chart that just shows the trend without the noise. Here's a screenshot that is hand drawn which I want to automate. Thanks for your interest.
No, Its a gann style swing chart that just shows the trend without the noise. Here's a screenshot that is hand drawn which I want to automate. Thanks for your interest.
Look for Kagi chart not for Manhattan chart
No, Its a gann style swing chart that just shows the trend without the noise. Here's a screenshot that is hand drawn which I want to automate. Thanks for your interest.
That is Kagi chart
Thanks for pointing me towards the Kagi chart, had heard of it but never looked into it. The charts look similar but the algorithms differ greatly. I have downloaded one to test, but I think the best it can do is help me work out some coding problems that I have. Thanks again, and i am open to any other ideas, as I am a very ordinary coder.
What is the formula of "Manhattan" chart?
What is the formula of "Manhattan" chart?
Its only called manhattan chart because it looks like the Manhattan skyline, it is just a swing chart based on the theory of WD Gann ( I know this will bring out the Gann haters). So the formula is just three lower lows or three higher highs for a change in direction, with the exception that if the previous swing low/high is broken within three bars, that is still a change in direction. Not sure if you can help me with the coding, but so far I can get the change day in an array, just not sure how to look back to the lowest low or highest high since last change day. Also not sure if to use numerous segments and how to go about naming each individual, or to use SetIndexBuffer() like some of the "pivot" indicators where the price from one day to the next is connected by a line.
Sorry for the solid block of words there, I broke it into 2 parts but thats not how it came out. Can someone tell how how to start a new paragraph. I used enter but it did not work in the message. Cheers.
- Free trading apps
- Over 8,000 signals for copying
- Economic news for exploring financial markets
You agree to website policy and terms of use
Is it possible to code a manhattan style chart (swing chart) in mt4. In Amibroker, the plot function uses StyleStairCase, but I can not find anything like that on mt4. I was not able to find anything thru search, if this has already been mentioned can you point me in the right direction. Thanks