ROC as Percent oscillator
Hi,
Asking if anyone would please show how to convert an unbound moving value output to a percent bound oscillator?
ROC is shown below as a basic unbound oscillator and the question is the correct code to express it as a percentage bound oscillator contained within +/- 100%, either side of zero.
Can the data set's scope be bound in this way to give a contained range, kind of like RSI is contained 0-100 but instead distributed as +/- 100 and bound inside that range or slightly larger total range like +/- 110%?
Thanks for any examples. 
ROC oscillator output shown:
Did you try stochastic or rsi as a way of normalizing?
For example this :
Assume that there are n rows with seven variables, A, B, C, D, E, F and G, in the data. We use variable E as an example in the calculations below. The remaining variables in the rows are normalized in the same way.
The normalized value of e[SUB]i[/SUB] for variable E in the ith row is calculated as:
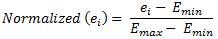
where
E[SUB]min[/SUB] = the minimum value for variable E
E[SUB]max[/SUB] = the maximum value for variable E
If Emax is equal to Emin then Normalized (ei) is set to 0.5.
and then it is easy to convert it to 0 to 100 range
Thanks for both,
I did look at RSI as an example and I can fairly see the basis of the difference. I can also visualize how the second formula example shown operates in a basic sense. I just don't know how to convert the current ROC shown in the original thread correctly to create the +/-100% binding or if that's even viable in an unbound set. I don't want to seem like a troll, but my acquired math skills hit a brick wall in trying to picture the whole formula to capture the ROC shown correctly in code for the result.  Possibly an unbound output can be constrained by setting the indicator manually for fixed limits but I'm guessing it would over-range. I'm frustrating over the correct expression without goofing up the essential data trying to formulate it
I'm basically trying to do more than I know how to do correctly so I end up poking at trial and error without a competent example I can be sure is actually working right, if that makes sense. Once I end up upside down in trial and error I lose continuity in rinse/repeat jail and frustration. Converting to distributed either side of zero is one thing but then binding the entire set within a percentage I start to lose grasp for a properly formed integral I think.
Also,
I don't want to end up clipping over-range values but on an unbound data-set I'm not getting my head wrapped around how the unlimited potential range ends up scoped to remain inside a +/- 100% containment. It might have an upper limit of +/- 200 even and a level setting of 100 within those boundaries, but it still seems like the full scope has to be among the indicators total data set, so possibly I have to bind it to X bars of history else the relative values could get fairly compressed? Doing that would seem to invite a repainted result if new incoming data changes the prior contained range?
I guess I won't know if that's a problem until I can get output working to examine it further.
Also,
I don't want to end up clipping over-range values but on an unbound data-set I'm not getting my head wrapped around how the unlimited potential range ends up scoped to remain inside a +/- 100% containment. It might have an upper limit of +/- 200 even and a level setting of 100 within those boundaries, but it still seems like the full scope has to be among the indicators total data set, so possibly I have to bind it to X bars of history else the relative values could get fairly compressed? Doing that would seem to invite a repainted result if new incoming data changes the prior contained range?
I guess I won't know if that's a problem until I can get output working to examine it further.Maybe this helps : https://www.mql5.com/en/forum/178018/page26
You have a full example there of one way how macd (which is also an unbound indicator) can be normalized
Thanks again,
That's pretty interesting. The binding must be working because the MacD shows it's going into clipping at saturation which is tolerable, given it's constrained and pointing to overkill strength of signal it's at least keeping the entire data set in a total bound scope.
The change in zero crossing / time threw me at first, but then I noticed the bars settings are different on the two in the MadD comparison.
I guess I have to do some more time in rinse/repeat jail until I can either define and explain what I need more accurately or I can devise it out of the examples.
I may end up just leaving ROC in linear mode and riding a fast weighted MA on it for relative comparison. The end game was to separate ROCV for up and down volume bar relevance with price motion. I was wanting to avoid the MA scenario to avoid lag and see if there was any predictive nature among ROC indicative volume. I'm thinking a similar ploy on OBV might support same with zero derived by locating the mean between the upper and lower unbound limits bound inside a total moving range if necessary.
Coincidental alignment of uncorrelated volume references appears to be earning some popularity in perceiving Market Maker influences on multiple time frames compared, given volume effects in HFT today. Odd as that sounds, I'm seeing it may have some basis even relative to session activity, so I wanted to try to stabilize the data sets to get valid comparisons across multiple time domains.
Examples given, greatly appreciated thank you.
Thanks again,
That's pretty interesting. The binding must be working because the MacD shows it's going into clipping at saturation which is tolerable, given it's constrained and pointing to overkill strength of signal it's at least keeping the entire data set in a total bound scope.
The change in zero crossing / time threw me at first, but then I noticed the bars settings are different on the two in the MadD comparison.
I guess I have to do some more time in rinse/repeat jail until I can either define and explain what I need more accurately or I can devise it out of the examples.
I may end up just leaving ROC in linear mode and riding a fast weighted MA on it for relative comparison. The end game was to separate ROCV for up and down volume bar relevance with price motion. I was wanting to avoid the MA scenario to avoid lag and see if there was any predictive nature among ROC indicative volume. I'm thinking a similar ploy on OBV might support same with zero derived by locating the mean between the upper and lower unbound limits bound inside a total moving range if necessary.
Coincidental alignment of uncorrelated volume references appears to be earning some popularity in perceiving Market Maker influences on multiple time frames compared, given volume effects in HFT today. Odd as that sounds, I'm seeing it may have some basis even relative to session activity, so I wanted to try to stabilize the data sets to get valid comparisons across multiple time domains.
Examples given, greatly appreciated thank you.Whatever normalization or standardization is used on time series data (or its derivative of time series), there will be some "deformation". As far as I am concerned I tend to look if it is useful (the normalization/standardization) or not. As far as MACD is concerned, that type of normalization seems to be useful (frequently the crosses are before macd crosses happen) and it tends to give use a cleaner picture of the trend (see the example).
But, anyway, try to use different types of normalizations (see posts starting from this one https://www.mql5.com/en/forum/179686 that are dealing with different types of normalizations) and then you can decide which one is the most suitable to what you intend to use it for (and by all means, experimenting with the normalization periods is a must)
Is there a moving average of rate of change indicator?
I know eSignal have a standard Ma of RoC but have not seen one in MT4.
TEAMTRADER
Is there a moving average of rate of change indicator?
I know eSignal have a standard Ma of RoC but have not seen one in MT4.
TEAMTRADERTEAMTRADER
You can always drag an average to ROC indicator and chose "apply the previous indicator data". That way you will get that very quickly without any changes in code
I dragged a ma separate over the roc but can't see "apply the previous indicator data".
Where is this box please?
TEAMTRADER
- Free trading apps
- Over 8,000 signals for copying
- Economic news for exploring financial markets
You agree to website policy and terms of use
Hi,
Asking if anyone would please show how to convert an unbound moving value output to a percent bound oscillator?
ROC is shown below as a basic unbound oscillator and the question is the correct code to express it as a percentage bound oscillator contained within +/- 100%, either side of zero.
Can the data set's scope be bound in this way to give a contained range, kind of like RSI is contained 0-100 but instead distributed as +/- 100 and bound inside that range or slightly larger total range like +/- 110%?
Thanks for any examples.
ROC oscillator output shown: