ElliottFxTrader Forex Analysis usiing Elliott Wave Principle
EUR/USD H1:
General Overview for 20/11/2014: 11:30 CET
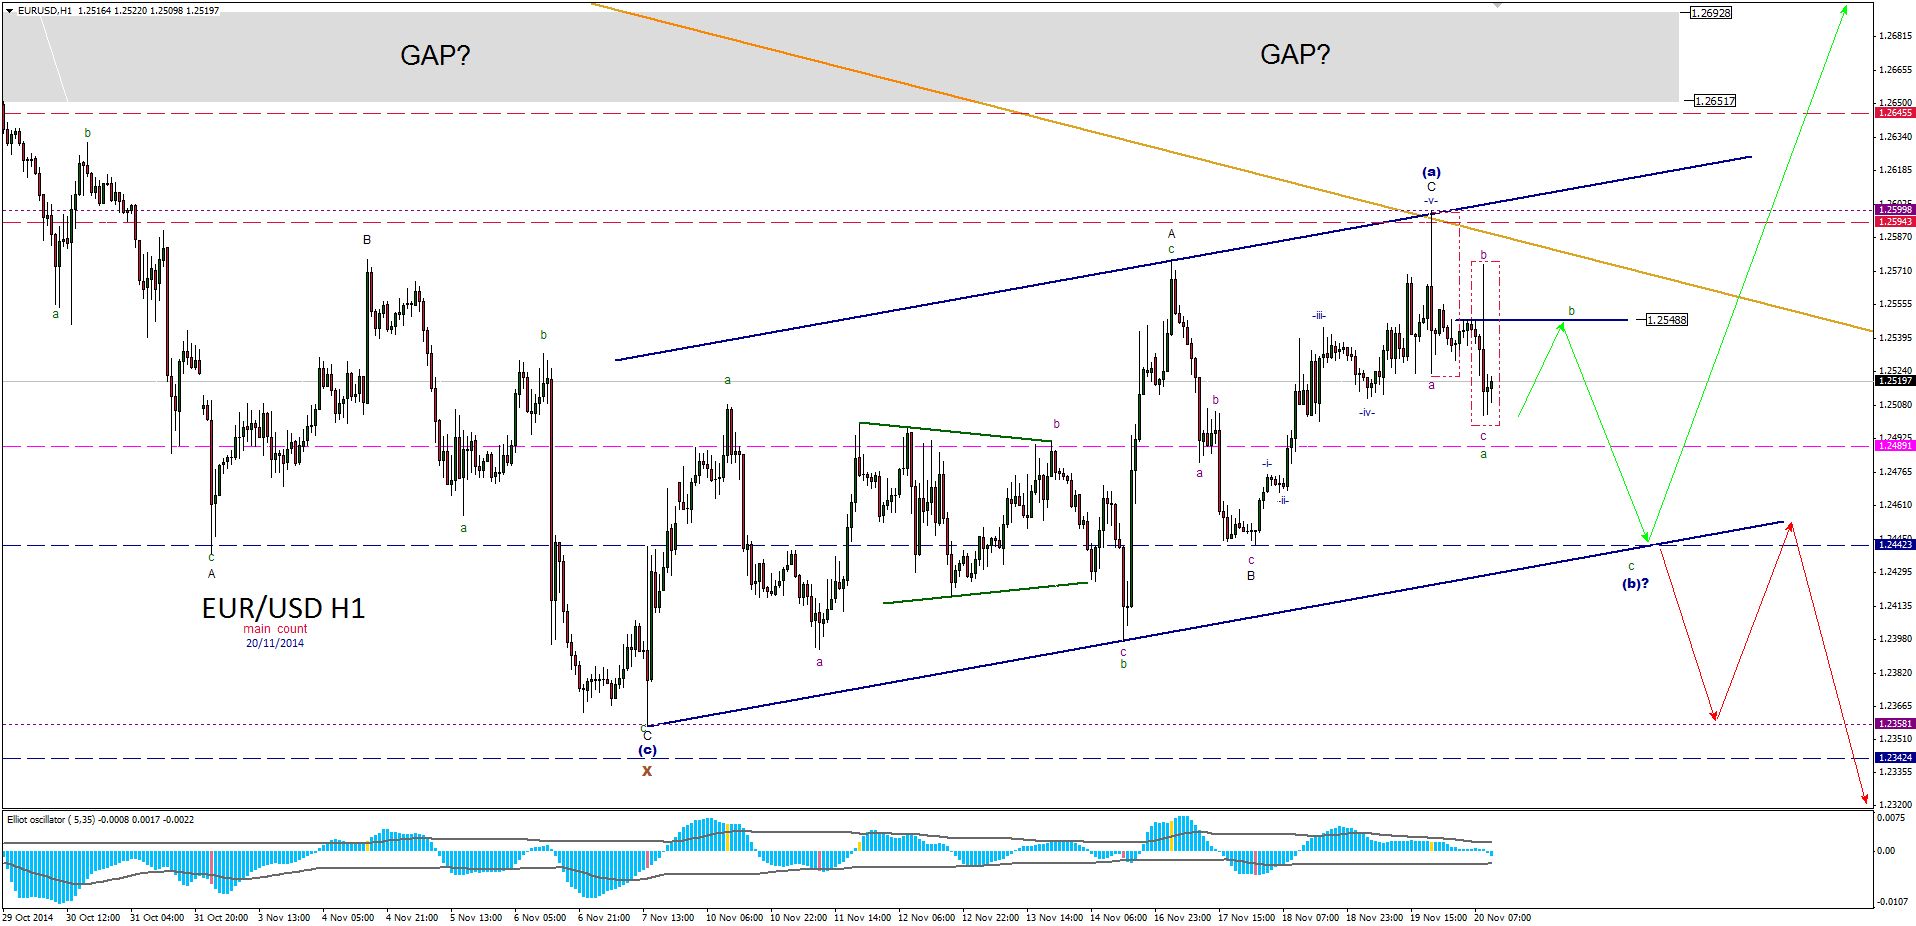
The wave development is still in a corrective cycle and there is really no need to trade this pair right now as the cycle appears to be rather complex and time consuming cycle. The suggested wave progression inside of the blue channel is clearly corrective and the golden trending is still providing a resistance. The question remaining whether the gap zone will be filled or not in the near future but the wave count clearly indicates the possibility of a farther upward wave progression up to the 1.2834 - 12936 zone. The current bias is:
SHORT-TERM Neutral to Slightly Bullish (corrective)
MID-TERM Neutral to Slightly Bullish (To complete the corrective cycle)
LONG-TERM Bearish (new lows)
Support/Resistance:
1.2652 - 1.2692 - GAP ZONE
1.2645 - WR2
1.2600 - Local Swing High
1.2594 - WR1
1.2548 - Intraday Resistance
1.2489 - Weekly Pivot
1.2443 - WS1
1.2358 - Local Swing Low
Trading Recommendations:
Stay away until corrective cycle is completed, confirmed and downtrend resume.
MORE ANALYSIS ON MY BLOG HERE!
★★★★★★★★★★★★★★★★★★★★★
IF YOU NEED MORE DETAILED ELLIOTT WAVE COUNTS,
SIGNALS
AND
EDUCATIONAL MATERIALS,
THEN JOIN MY VIP SERVICE!
Details here:
V.I.P. Service ~ Elliott Wave Forex, Futures and Stock Market Blog
★★★★★★★★★★★★★★★★★★★★★
Technical analysis of USD/CAD for November 28, 2014 2014-11-28
General overview for 28/11/2014 09:20 CET
The level of 1.1368 has been violated and that means the ending diagonal idea is now invalidated. Currently, the main count has been invalidated as well and the alternative count is in play right now. This count indicates more impulsive wave development to the upside as the market broken out from the golden corrective channel. The first major target area is the supply zone between the levels of 1.1445 - 1.1465, but more advanced impulsive structure that is being expected is the zone is broken.
Support/Resistance:
1.1504 - WR3
1.1445 - 1.1465 - Supply Zone
1.1437 - WR2
1.1389 - 1.1395 - Wave iii Target Zone
1.1367 - Intraday Support
Trading recommendations:
Traders should consider buying the dips as the market has finally broke out of the corrective channel. All SL should be placed below the level of 1.1224.
Technical analysis of EUR/JPY for November 28, 2014 2014-11-28
General overview for 28/11/2014 10:00 CET
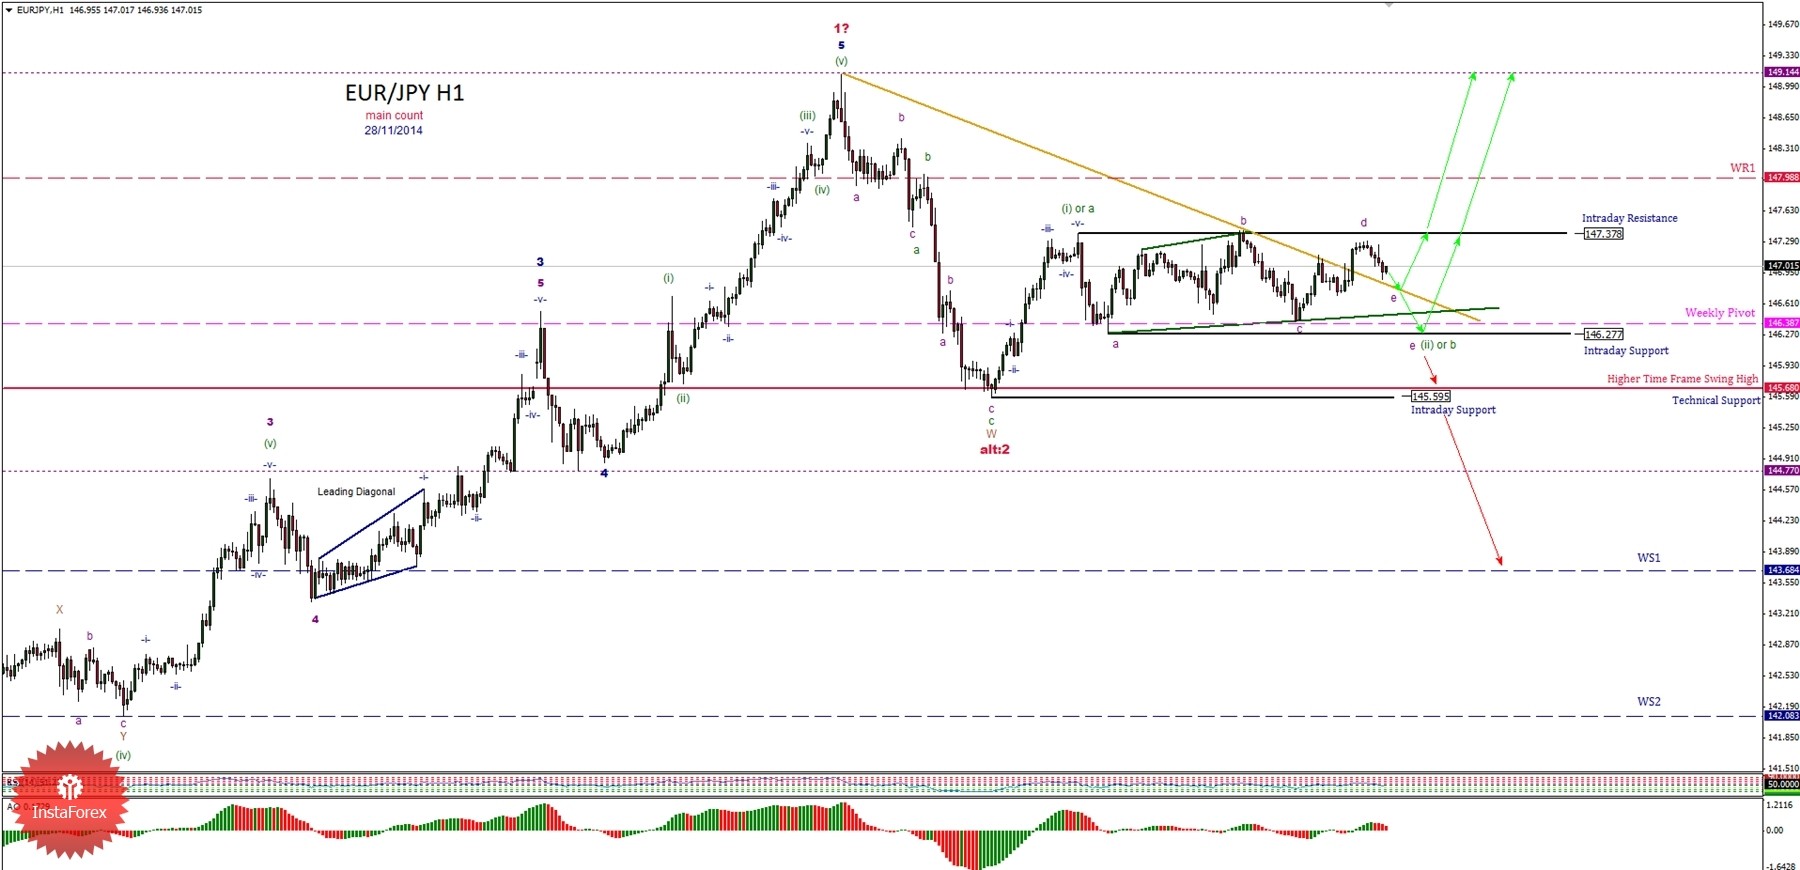
The market is still in more extended corrective cycle as the suggested triangle shape has not been completed yet. Any breakout above the intraday resistance at the level of 147.37 is bullish and any breakout below the intraday support at the level of 146.27 is bearish.The bias is still slightly bullish as the corrective cycle has not been finished yet.
Support/Resistance:
149.14 - Swing High
148.50 - Intraday Resistance
147.98 - WR1
147.37 - Intraday Resistance
146.27 - Intraday Support
146.38 - Weekly Pivot
145.67 - Technical Support
145.84 - Intraday Support
Trading recommendations:
Still the buy order recommended at the beginning of the week should be kept open and SL should be placed below the intraday support at the level of 146.28 and TP level in longer term should aim for the level of 147.98 and 149.14. Breakout below the level of 146.28

Technical analysis of EUR/JPY for December 1, 2014 2014-12-01
General overview for 01/12/2104 08:20 CET
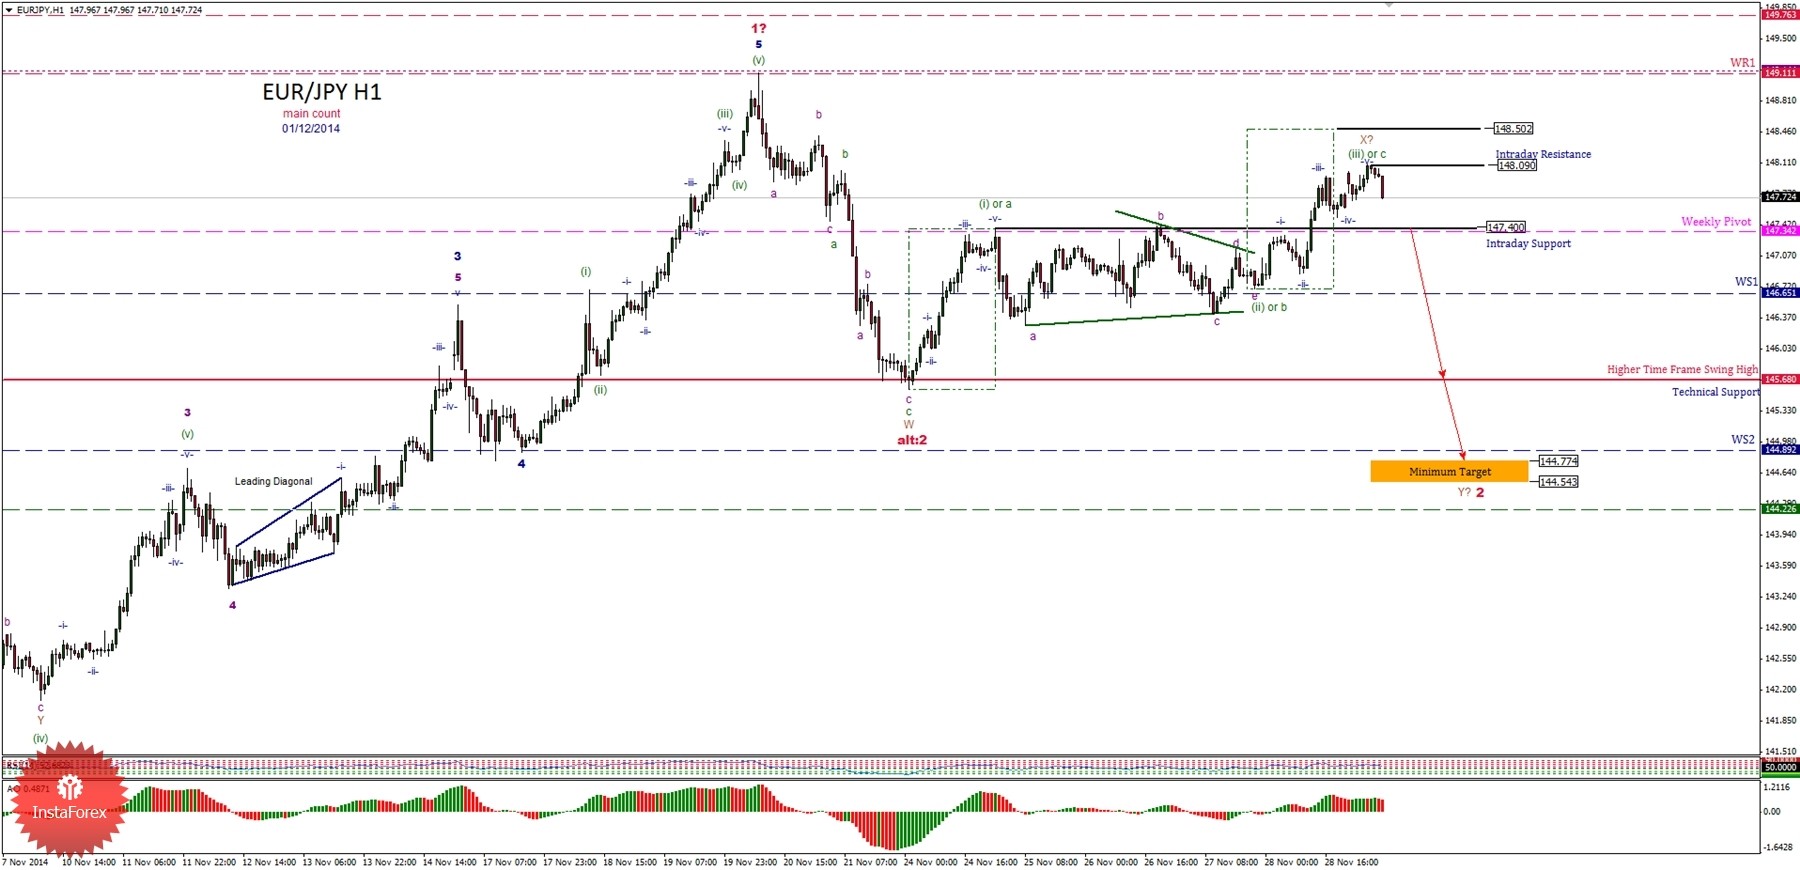
The corrective cycle in the shape of abc green zig-zag might have been completed and the higher degree corrective wave X brown might have been completed as well. This would mean, the market should continue to trade lower now and the support levels should be now violated as the internal intraday bearish corrective cycle in wave Y brown resumes to the downside. The minimum target zone is between the levels of 144.54 144.74, but the downside correction might extend even lower.
Support/Resistance:
149.11 - WR1
148.09 - Intraday Resistance
147.40 - Intraday Support
147.34 - Weekly Pivot
146.65 - WS1
145.68 - Technical Support
144.89 - WS2
144.54 - 144.74 - minimum target level
Trading recommendations:
Traders should consider selling this pair from the current market levels with SL above the level of 148.10 and TP at the level of 144.77.
Technical analysis of USD/CAD for December 1, 2014
General overview for 01/12/2104 08:00 CET
The impulsive wave progression to the upside has not been completed yet. There is at least one more wave to the upside to be made unless the extension happens. The most important support is the technical support at the level of 1.1367, just below the weekly pivot at the level of 1.1379. Currently, the market is in a corrective cycle (sub-wave iv black) and when this cycle is completed the uptrend should resume.
Support/Resistance:
1.1465 - Swing High
1.1453 - Intraday Resistance
1.1422 - Intraday Support
1.1379 - Weekly Pivot
1.1367 - Technical Support
Trading recommendations:
Traders should consider buying the dips as the market has to complete one more wave to the upside. All SL should be placed below the level of 1.1376.
Read more: https://www.instaforex.com/forex_analysis/54003/

USD/JPY H4 Elliott Wave Analysis
- Free trading apps
- Over 8,000 signals for copying
- Economic news for exploring financial markets
You agree to website policy and terms of use
DAX30 FUTURES:
*General overview for 26/11/2014 12:50 CET*
On lower time frames traders can see, that the impulsive wave progression is unfolding to the upside and first targets has been projected at the levels of 10023 and 10175.
* Support/Resistance*
10175- Wave v Target Level
10084 - WR2
10023 - Wave iii Target Level
10014 - WR1
9567 - Weekly Pivot
*Trading recommendations:*
The bias is bullish until the minimum target is hit.
MORE CHARTS AND ANALYSIS HERE