[Request] Code an indicator for a good BO Strategy (Volume,ADX, RSI)
Looks GOOD Sir! Thank you so much!
Some Notes:
- So main filtering with our eyes before we enter the ARROW is make sure that we can see the volume bar difference well and its not barely seen but well seen that current bar smaller then last one. A good drop of the volume bar size from the last one - very important.
- Make sure during your trading entries that: Red candle with Green arrow and Green candle with Red arrow. The theory is that the trend continue. As suggested by the lead mentor of this strategy, Kobus Visser him self.
- The lead mentor of this strategy Kobus Visser suggesting to trade this strategy during London and NY. The currencies he use: EU, EJ, GU, GJ, UJ, AU & GJ
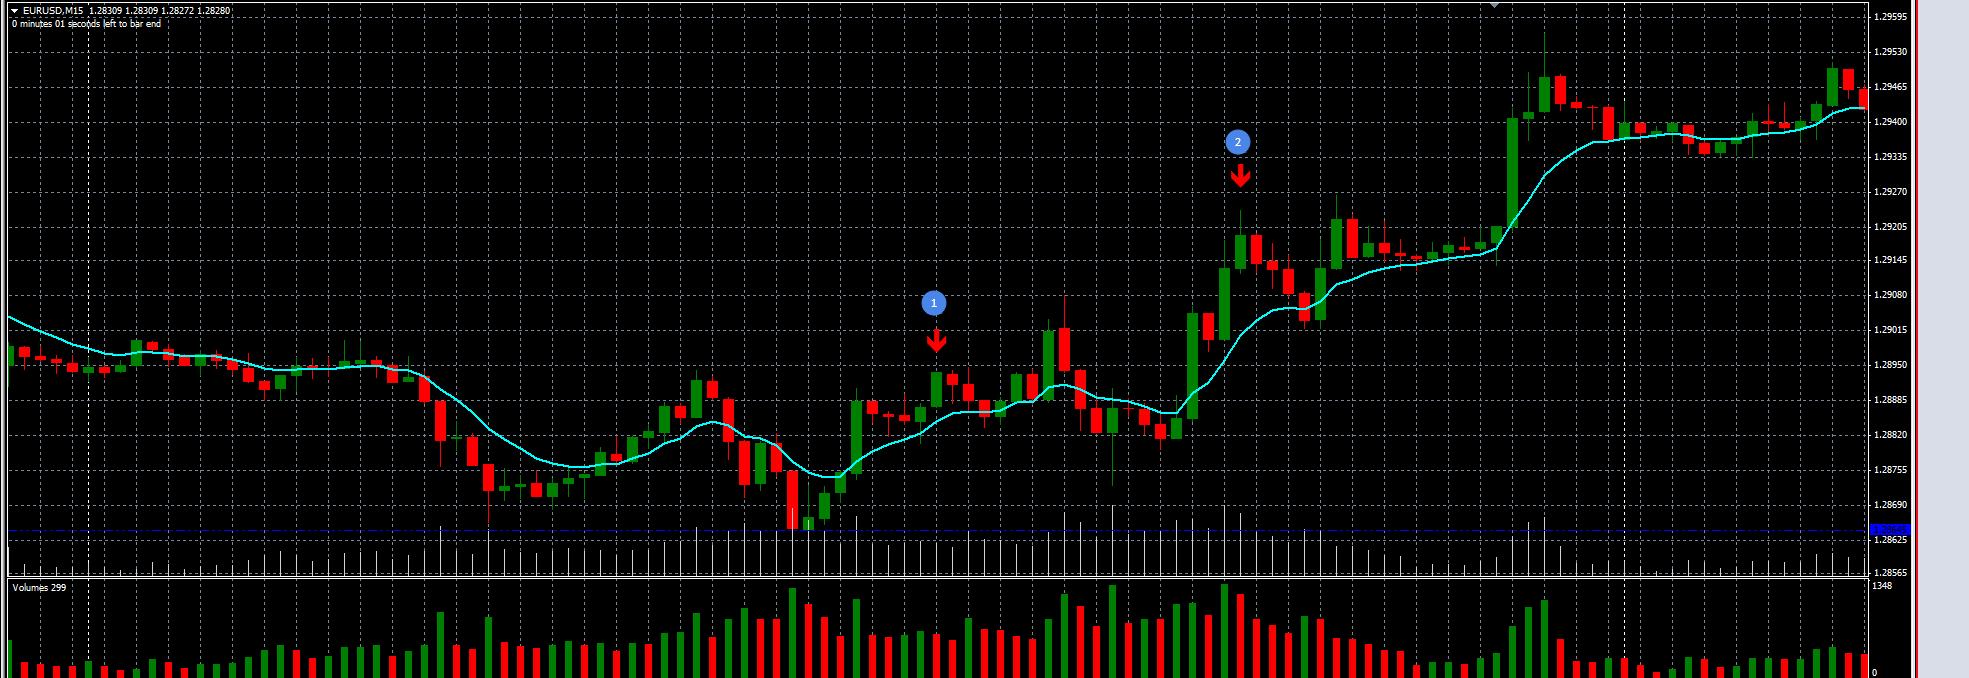
Example: figure #1 we will trade and figure #2 we will skip since last bar was not drastically bigger then the current.
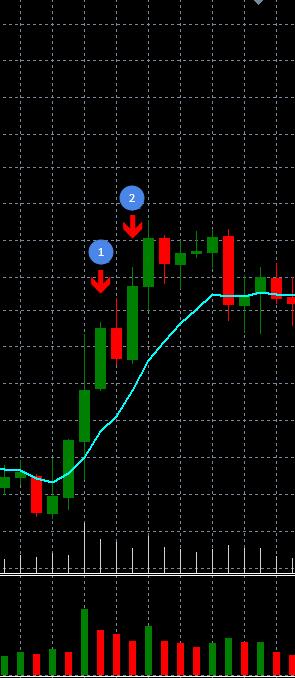
Example:figure #1 we will trade and figure #2 we will skip since last bar was not drastically bigger then the current.
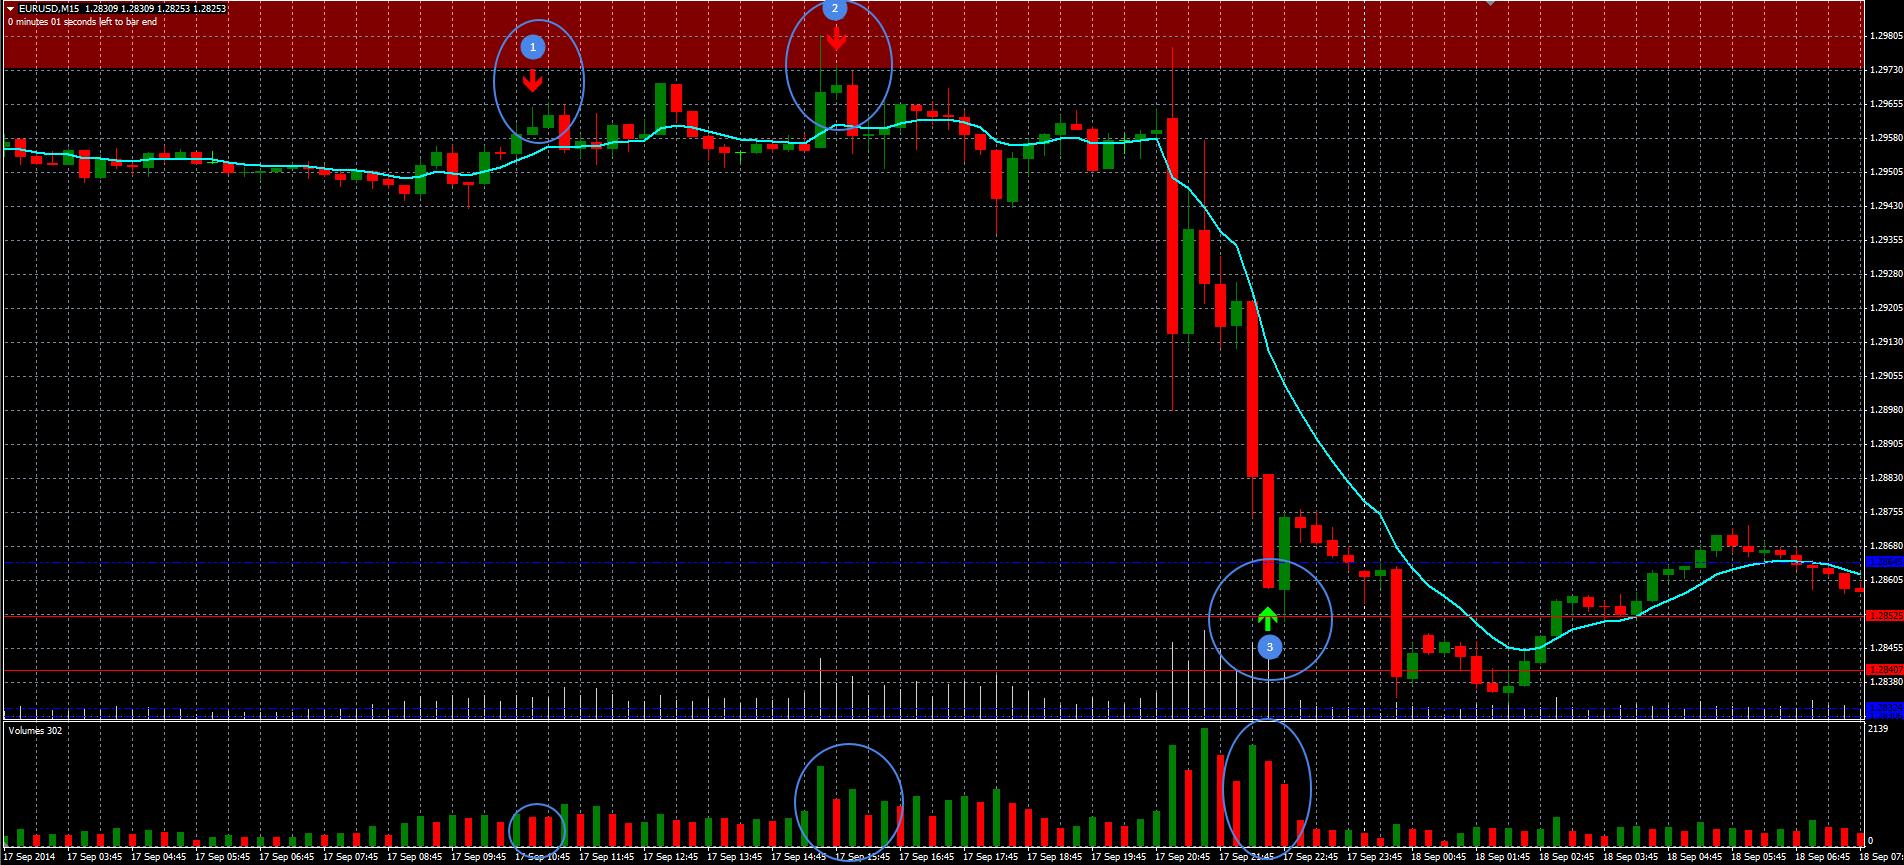
Here you can see figure #1 which is lower probability trade since different between green and red bar are not big enough while Figure #2 and #3 has higher probability rate due to higher difference in those volume bar drops:
GOOD SIGNALS ON THE WAY:
- Free trading apps
- Over 8,000 signals for copying
- Economic news for exploring financial markets
You agree to website policy and terms of use
Hello Coders!
I am looking here for some one to help out me and others who trade this BO strategy based on ADX, RSI and Volume.
I would like be fair and say that the credit for the core of this strategy goes to Kobus Visser who mentored us this strategy:
Forex Trading and Binary Options
Entry Rules:
Market Conditions:
Trending
Long:
- RSI is under 30
- ADX is under 20
- Volume Bar is lower than the previous volume bar
- Expiry is 15 Minutes.
Short:
- RSI is above 70
- ADX is under 20
- Volume Bar is lower than the previous volume bar
- Expiry is 15 Minutes.
PS #1:Works also on 5M in back testing. Didn't actually traded yet. However since those are non repaint indicators it supposedly shall work fine if it worked on back test.
PS #2:The diamond arrows based on speedometer but those aren't important. I just added it for those who just starting up with the strategy and need some visual help to get their attention to the chart and potential entries, however the entry it self is crucial to be entered within the rules above only, regardless of how many arrows you've. Supposedly get 3-5 good signals a day, trade without news and never over trade.
The indicator supposed to:
Screen Shots: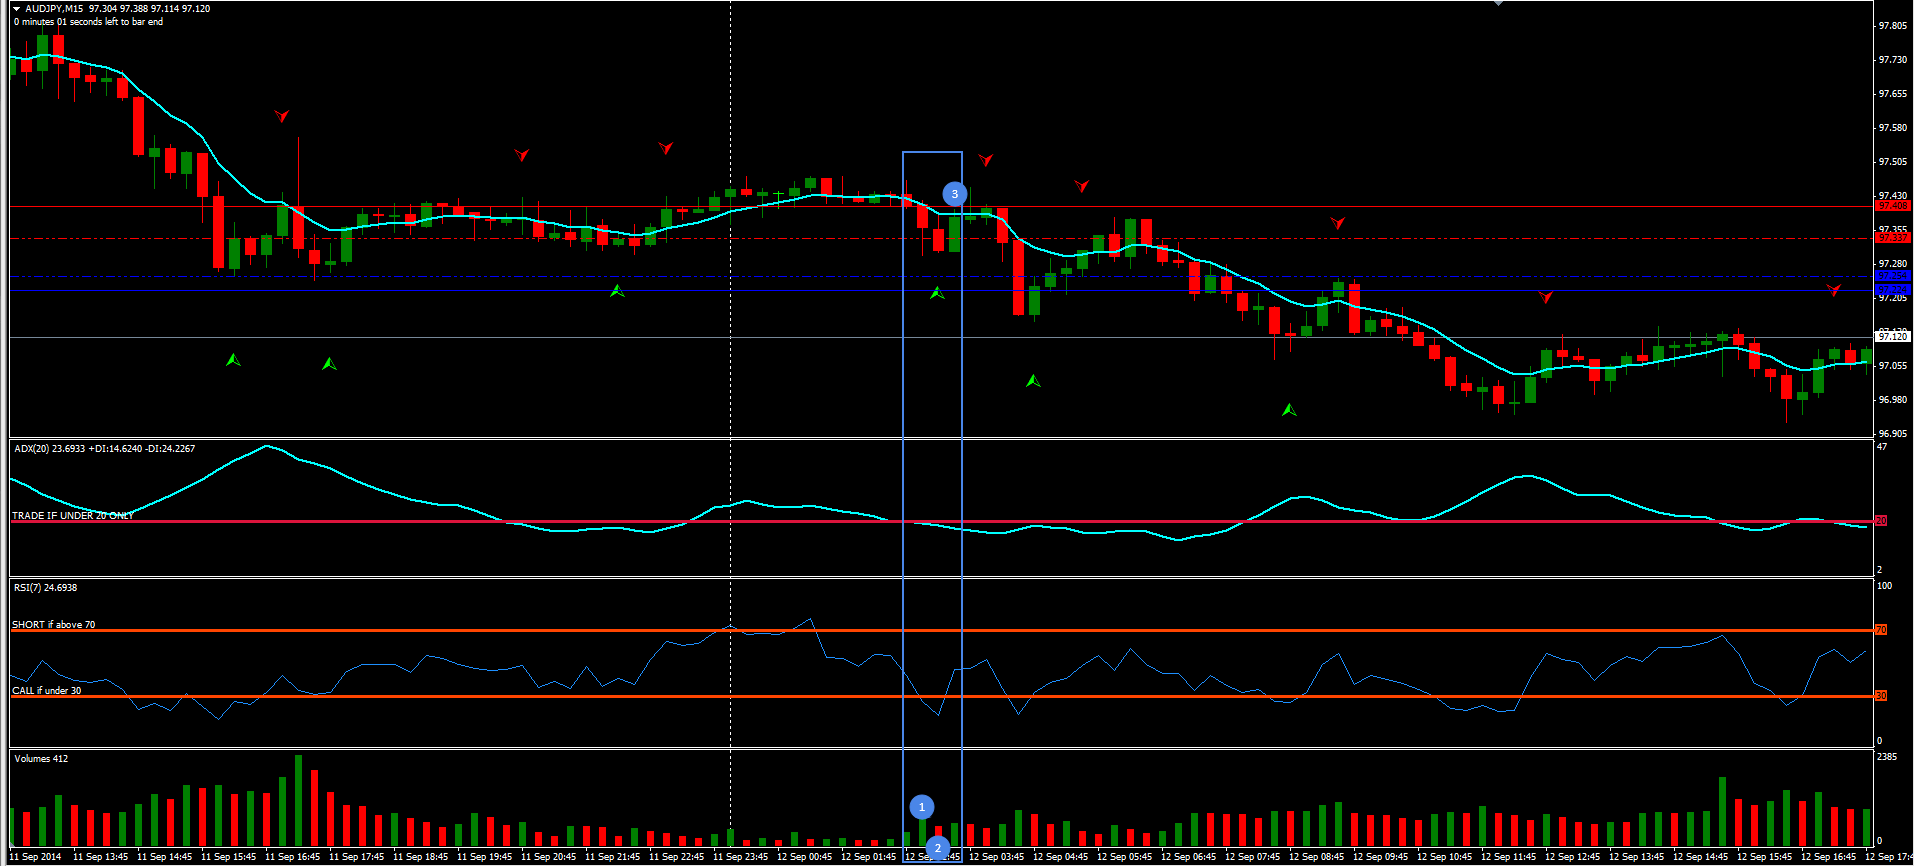
Looking forward your help!
Thank you so much!