Daily Technical Analysis from ACFX (Atlas Capital Forex)
Daily Technical Analysis from ACFX 11/12/2013
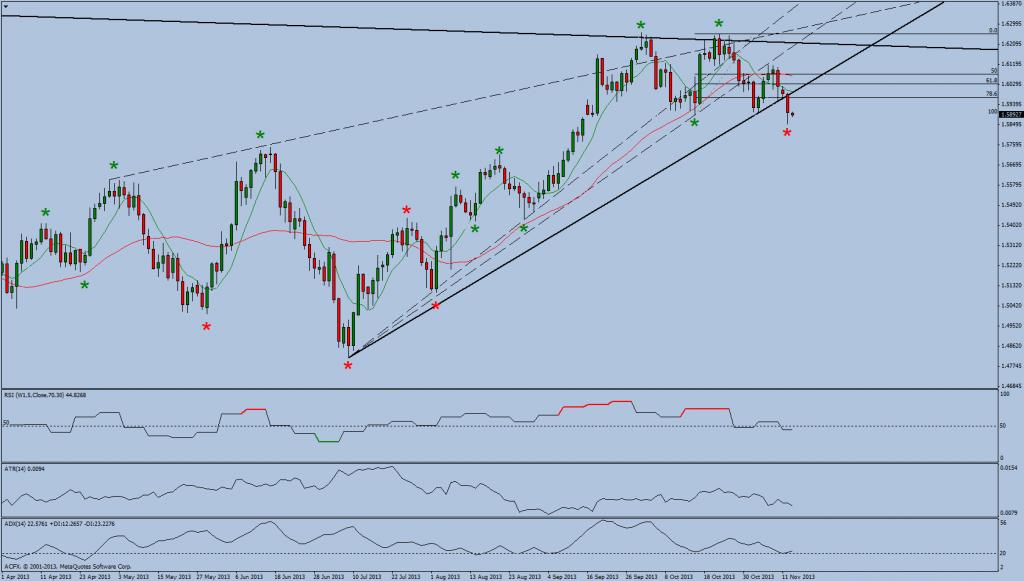
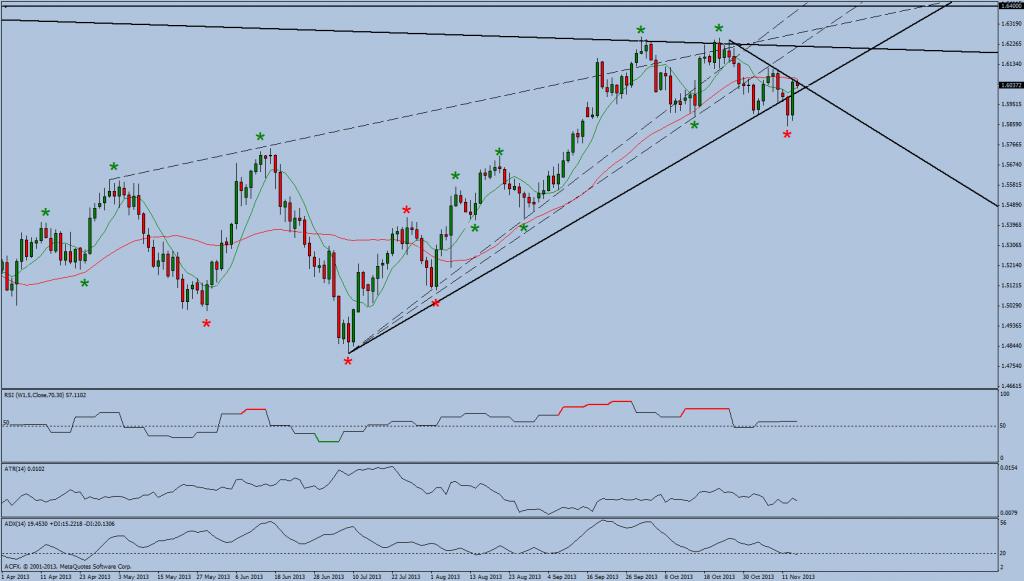
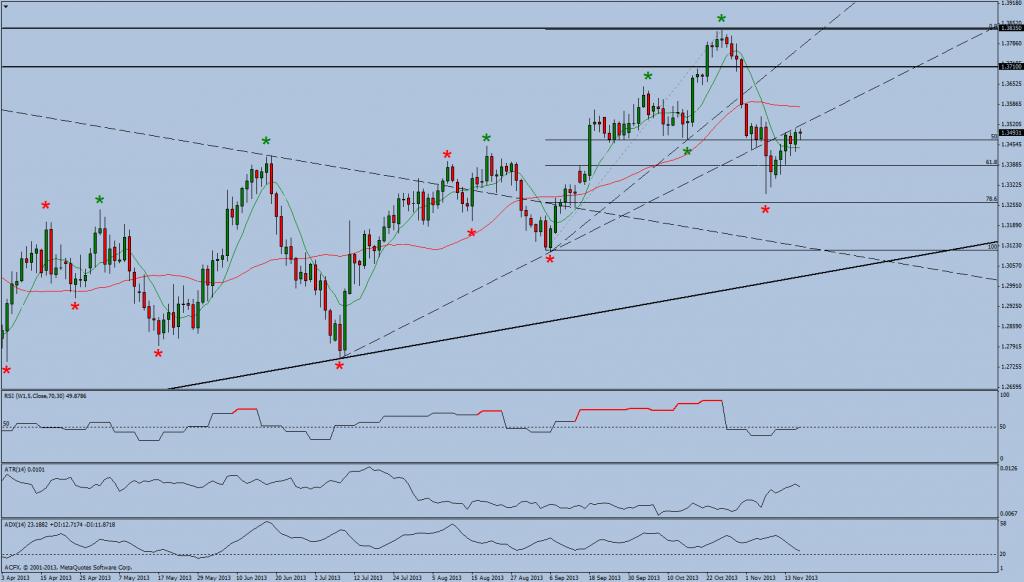
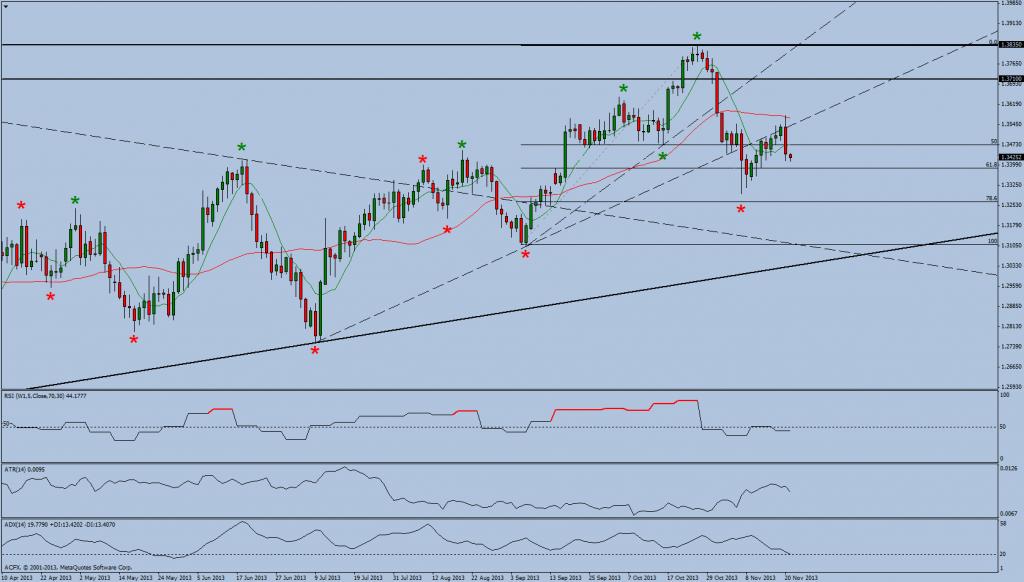
Daily Technical Analysis for EURUSD as at 12th November 2013
DAILY OVERVIEW
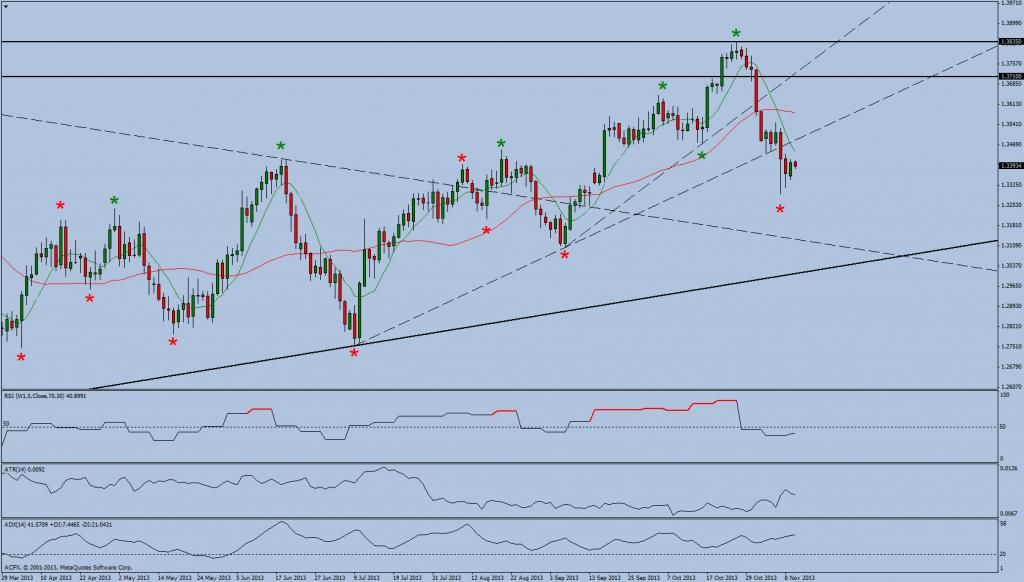
Trend : Down
Ambush Zone : -
Target 1 : -
Target 2 : -
Stop : -
Comments
Yesterday EURUSD experienced a corrective rally which saw it trade well within both Thursdays and Fridays ranges.
Intraday view
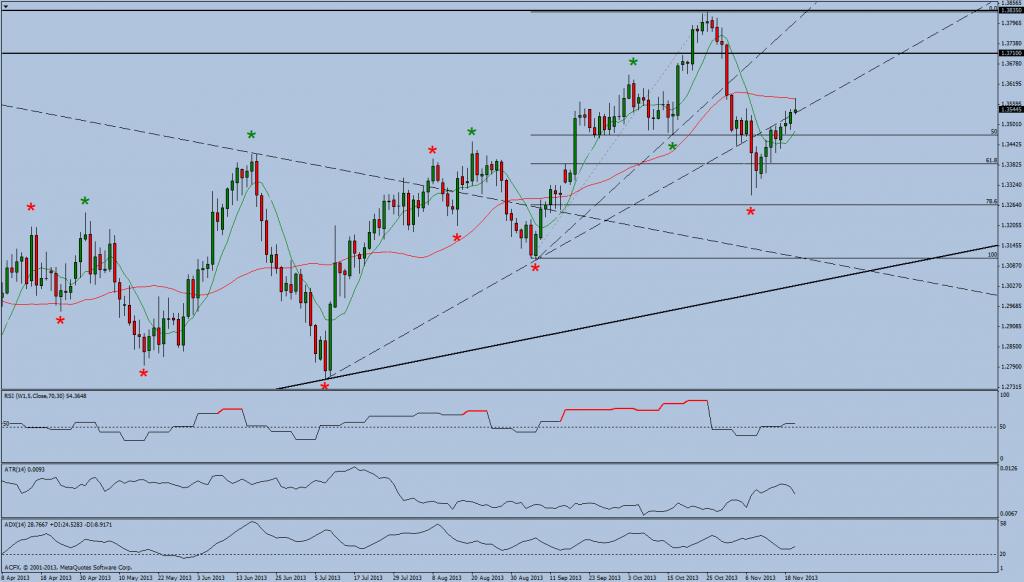
This morning’s EURUSD has opened with a downside break of the overnight range. The possible projected maximum daily ranges based upon current price action being 1.3317 to 1.3475.
We are currently monitoring the price action for indications that EURUSD can trade and sustain a move either above the high or beneath the low of Friday’s range which was 1.3417 to 1.3437. Breaks of this range will have initial targets the low of the 7th November or upside targets of the 8 period moving averages and prior trend line support.
Trade Ideas
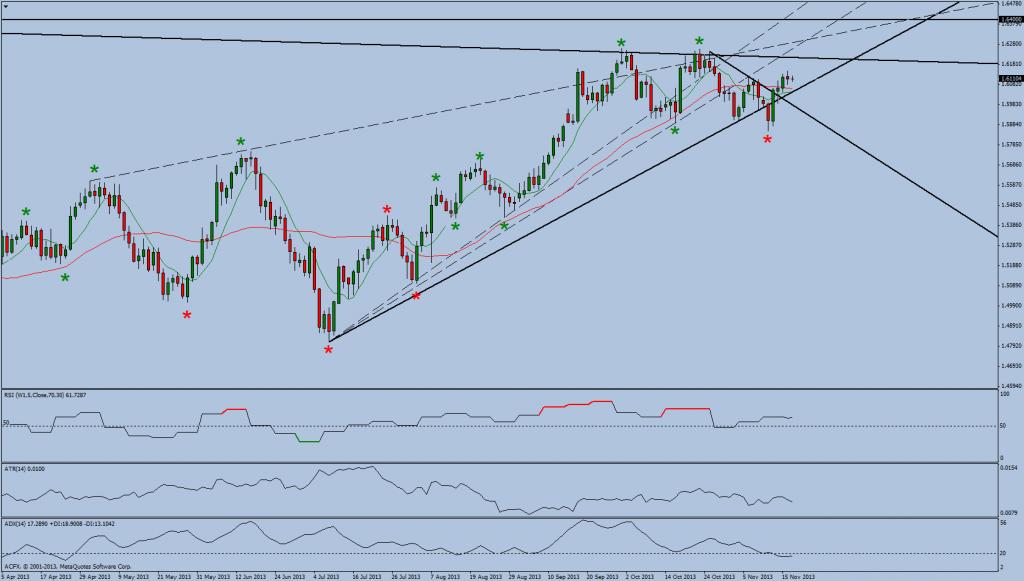
1. The breach of the 16th October prior isolated low has changed the daily trend on a swing basis from up to down. This negative swing bias has been confirmed by multiple breaches of trend line support and the moving averages being layered negatively. Furthermore the RSI positive divergence has been invalidated by the 7th November break down. As the dominant daily trend based on swing analysis is down corrective pullbacks especially to resistance areas could be views as potential value areas where shorts could be added.
2. However the weekly time frame continues to be swing positive. Therefore there is a possibility that the down trend on the daily chart is nothing more than a corrective sell off that brings the price action into potential value areas where long term swing position buy trades could be executed. EURUSD was supported during the down move and with the price action now extended from the averages could be a catalyst for long side position traders to take advantage of the lower prices. This scenario is valid as long as EURUSD can trade above the 6th September swing long which comes in around the 1.3100 area.
The Macro Technical Targets
The upside targets are 1.3470, 1.3530, 1.3650, and 1.3830. The downside targets are 1.3300, 1.3200, 1.3100 and 1.2750.
Scenario 1
As the dominant daily trend is down retracements into resistance areas such as the 8 period moving averages and trend line resistance or intraday swing failures could be potentially viewed as selling opportunities.
Scenario 2
Alternatively as EURUSD is extended from the averages there is a potential for further upside correction.
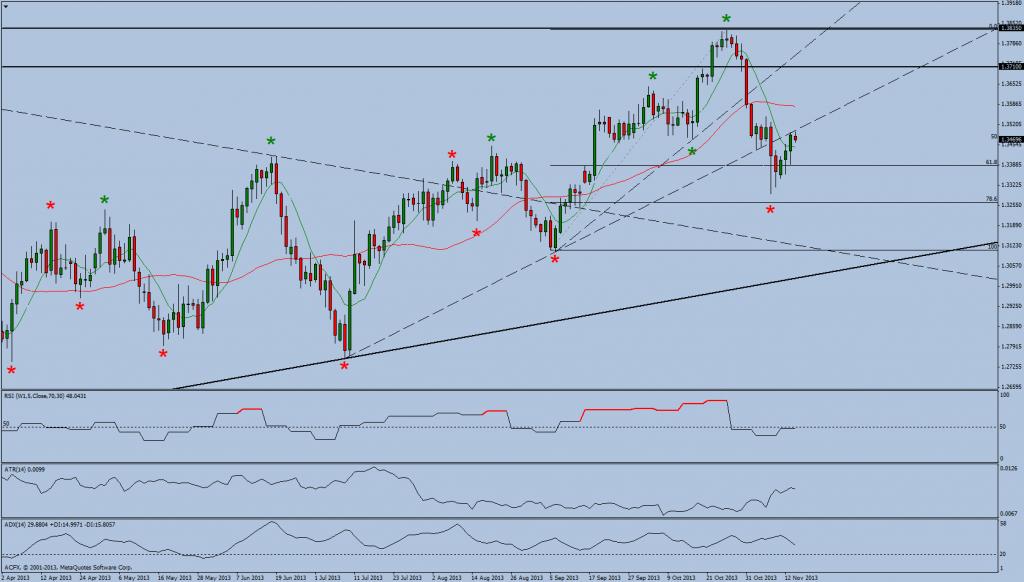
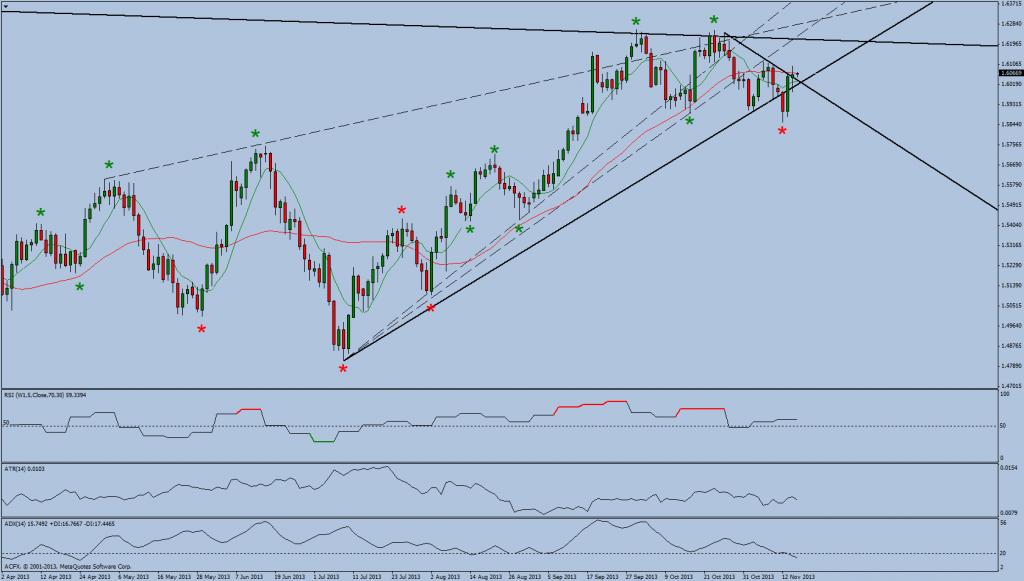
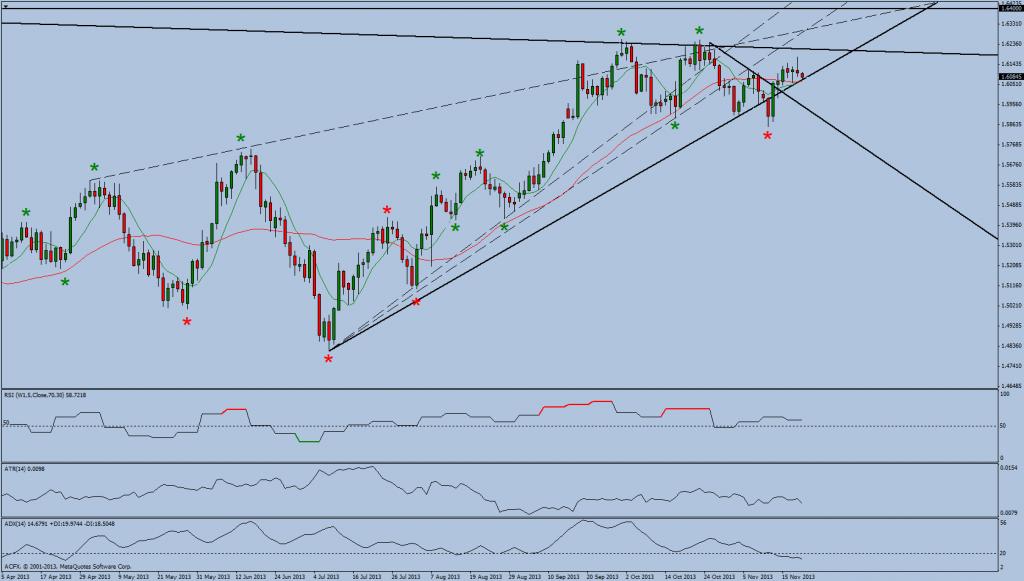
Daily Technical Analysis for GBPUSD as at 12th November 2013
DAILY OVERVIEW
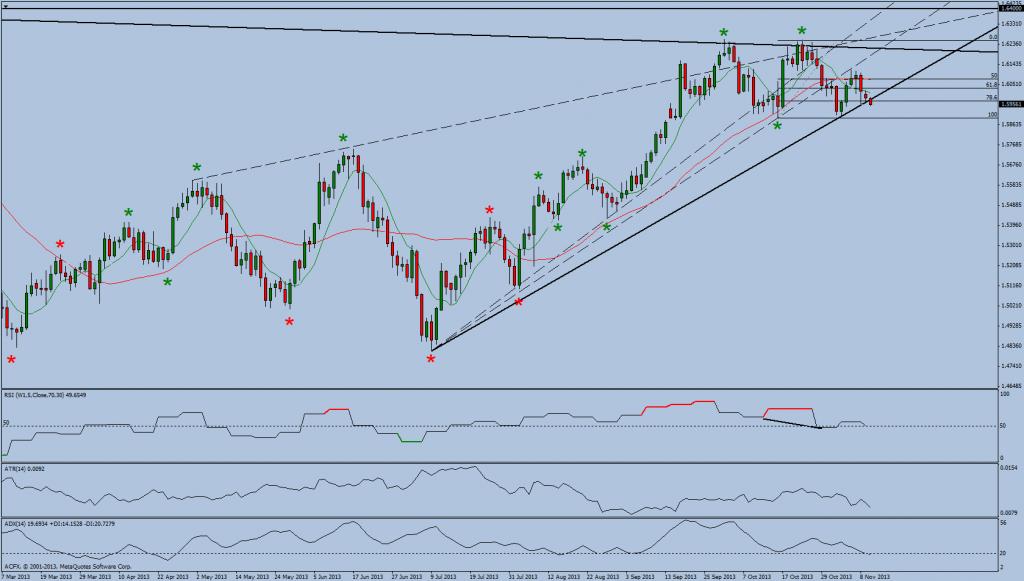
Trend : Long
Ambush Zone : -
Target 1 : -
Target 2 : -
Stop : -
Comments
Intraday view
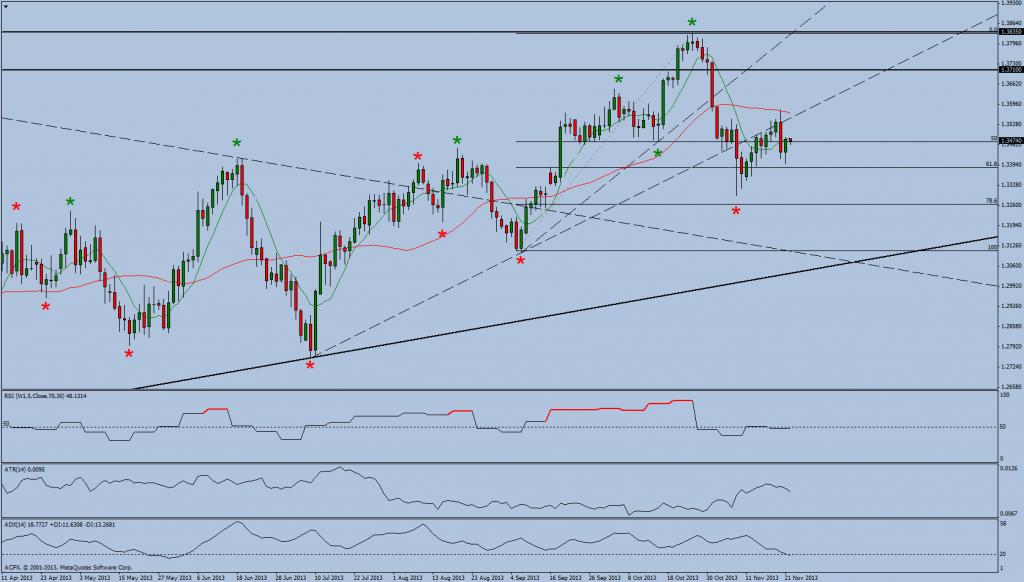
This morning GBPUSD has broken down from its overnight range and breached and trading well under trend line support. The possible projected maximum range based upon current price action being 1.5900 to 1.6038. We are currently monitoring a potential move down to the low of the 16th October at 1.5893.
Trade ideas
1. On a daily swing bases GBPUSD continues to trend positively on both daily and weekly time frames. However the current price action would appear to be attempting to print a lower high. Therefore it is important for the health of the current uptrend that GBPUSD does note trade beneath the 16th October isolated low. That the RSI is diverging positively does give the long side some encouragement but it should be noted that the averages have crossed negatively for the first time since July 2013. If GBPUSD does continue to trade lower market participants looking for value on the long side of the market would potentially be looking at the double bottom area of 1.5893 with intraday swing failures of lower highs possibly offering opportunities to nibble on the long side.
2. However as GBPUSD continues to breach multiple trend lines and with the price action now trading deep into Fibonacci support it would appear that the route of least resistance is to the down side with the initial target being the 1.5893 swing low.
Marco Technical Targets
1.6260, 1.6170, 1.5890, 1.5715, 1.5570, 1.5720
Scenario 1
As the dominant daily trend is up that GBPUSD is extended from its averages could offer opportunities to take long positions. However as the current market sentiment is fairly negative one would best look for areas where this down move stalls on an intraday basis so that long positions could possibly be entered.
Scenario 2
Alternatively as GBPUSD has broken trend line support areas there is potential for a move that takes the price action back down to 1.5893 being a prior isolated low that was printed on 16th October.
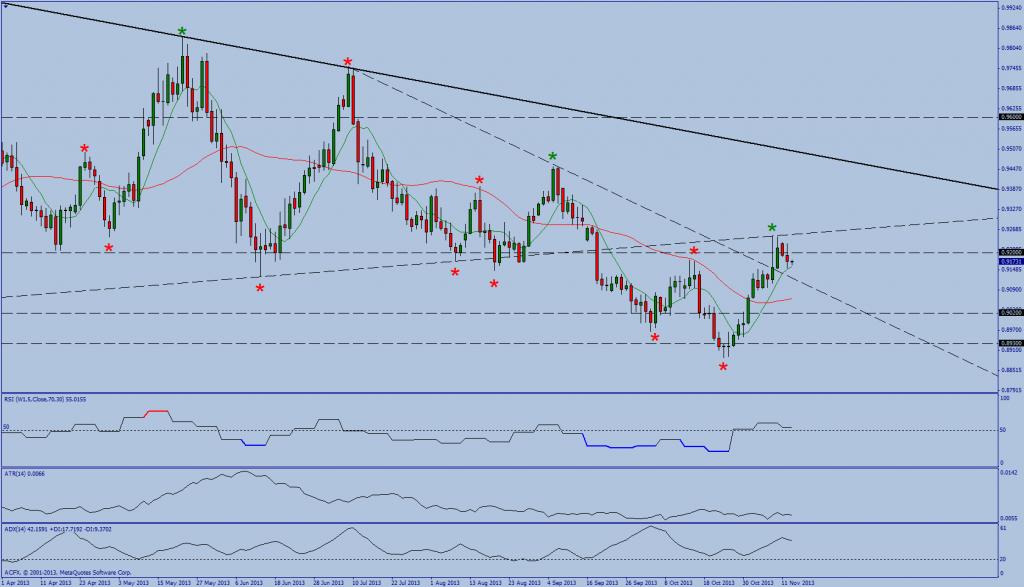
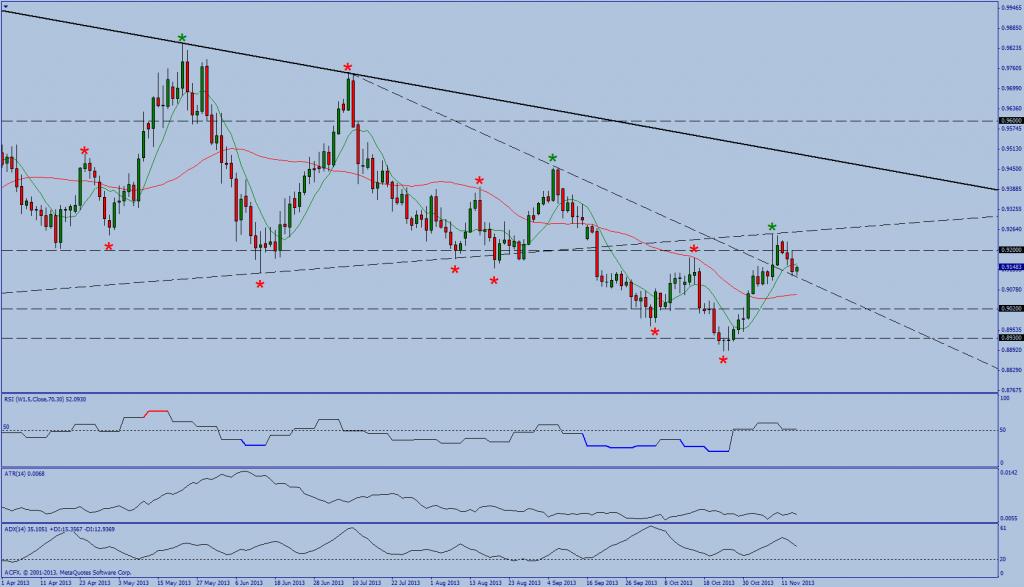
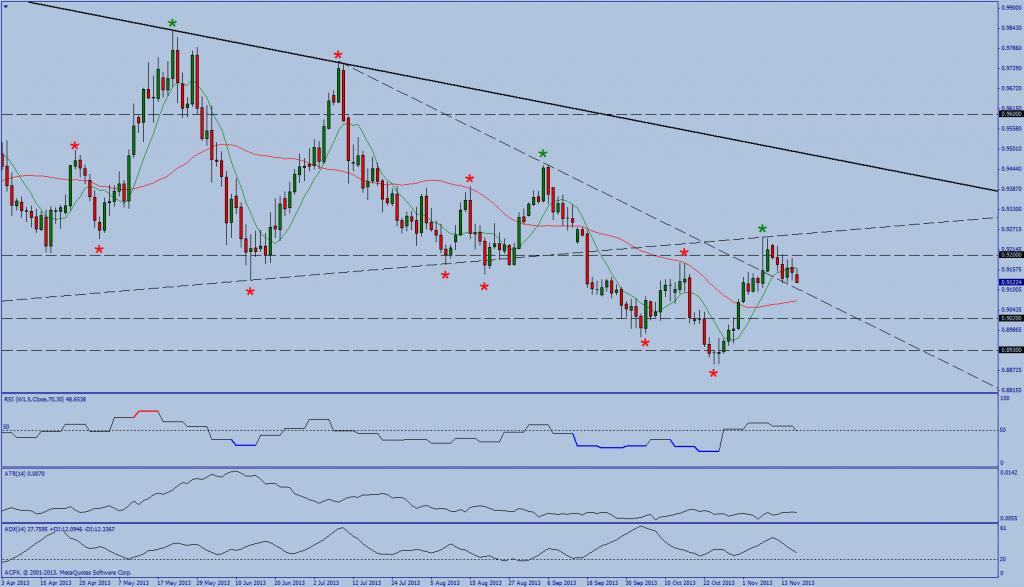
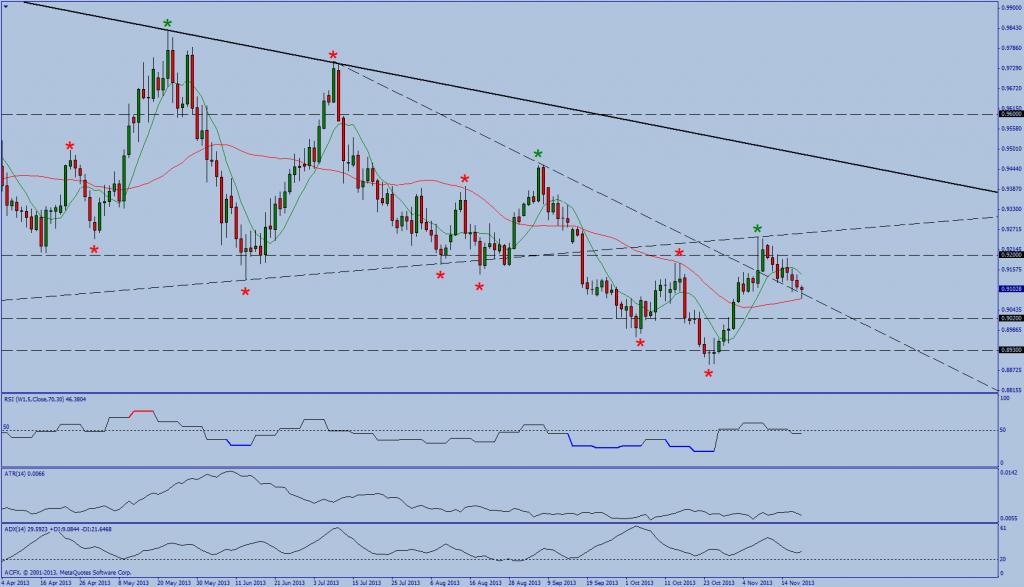
Daily Technical Analysis for USDCHF as at 12th November 2013
DAILY OVERVIEW
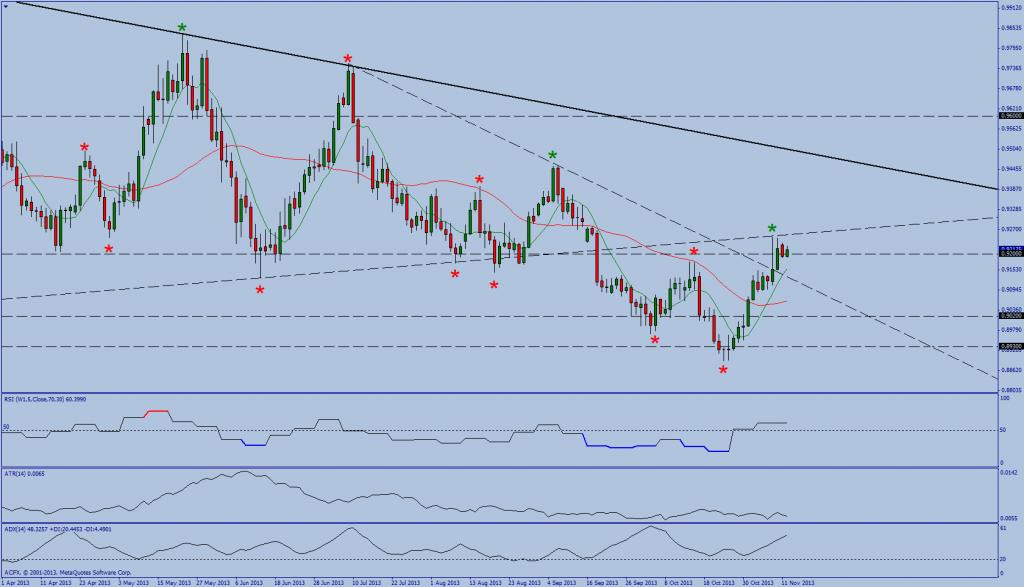
Trend : Up
Ambush Zone : -
Target 1 : -
Target 2 : -
Stop : -
Comments
Trade ideas
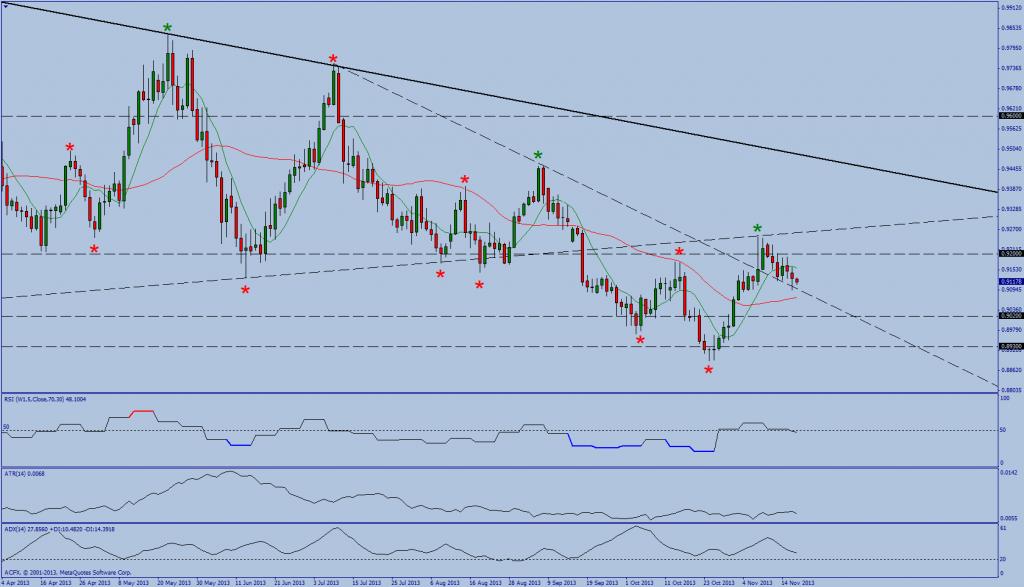
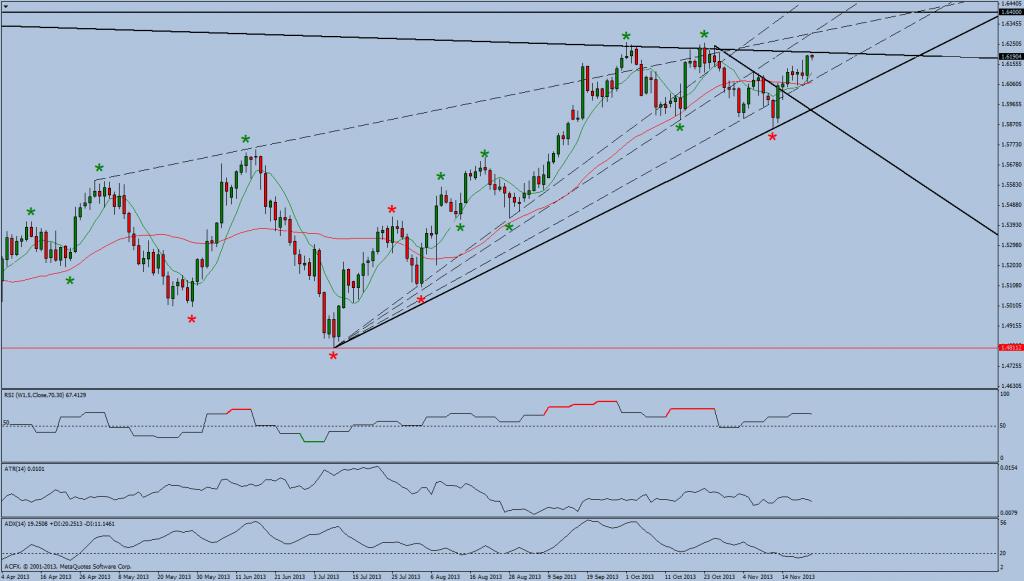
1. On a basis swing bases the trend is now positive following the breach of the prior isolated high. The moving averages are now layered positively and the breach of trend line resistance and the invalidation of Fibonacci resistance and the negative RSI divergence give further confirmation to the upside. The price action is somewhat consolidating within a four day range. Therefore we would like to see a break of Friday’s high and trend line resistance so as to give further confirmation to the up move. Intraday corrections and swing high failures could potentially offer the entry opportunities to test the long side.
2. However the weekly time frame continues to point down and the price action is now extended from the averages which could lead a downside correction. Intraday swing low failures could possibly offer entry opportunities to the short side.
Macro technical levels
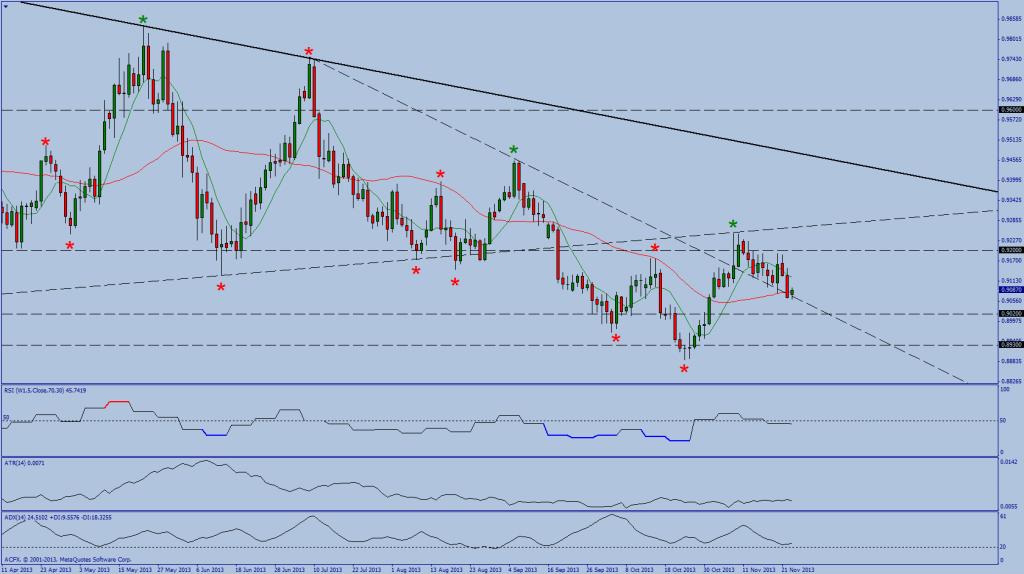
The macro technical levels are 0.9020 0.8930, 0.8570 and 0.9200.
Scenario 1
As there has been an upside break of the overnight range there is potential for a continuation of this move with the price action aiming for the target of last Thursday’s high.
Scenario 2
Alternatively the current intraday up trend could reverse following a failure to hold above a prior swing low.
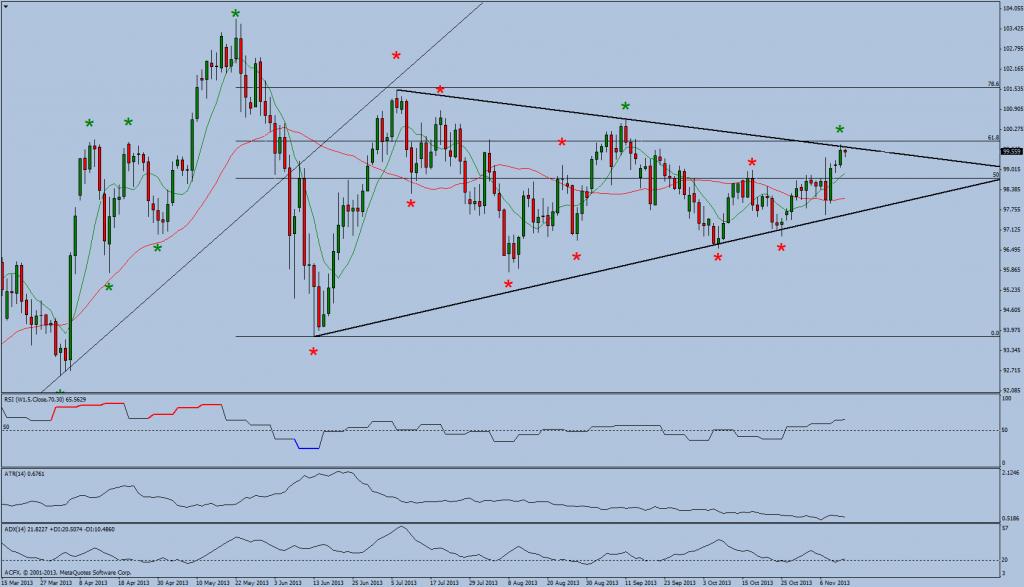
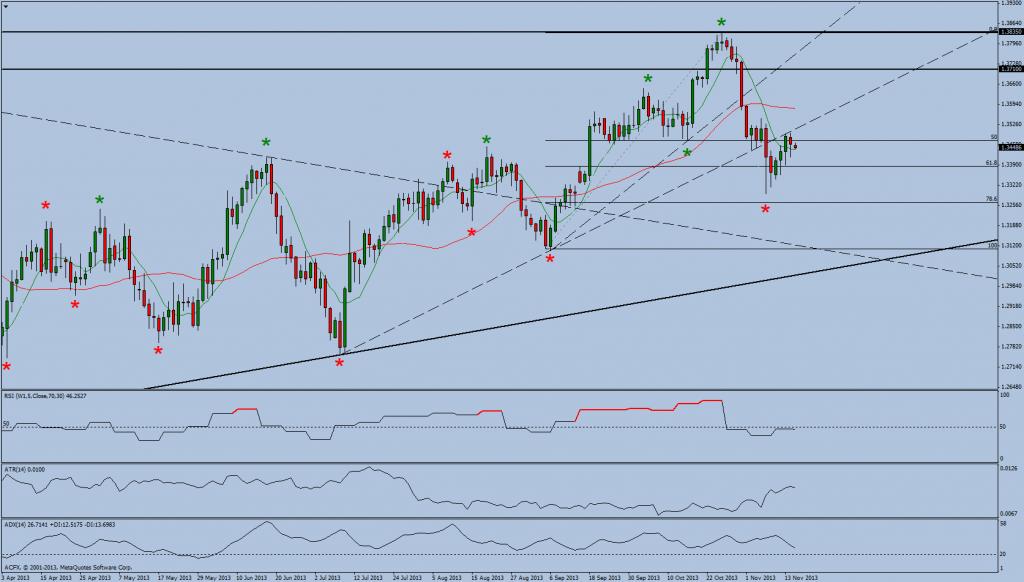
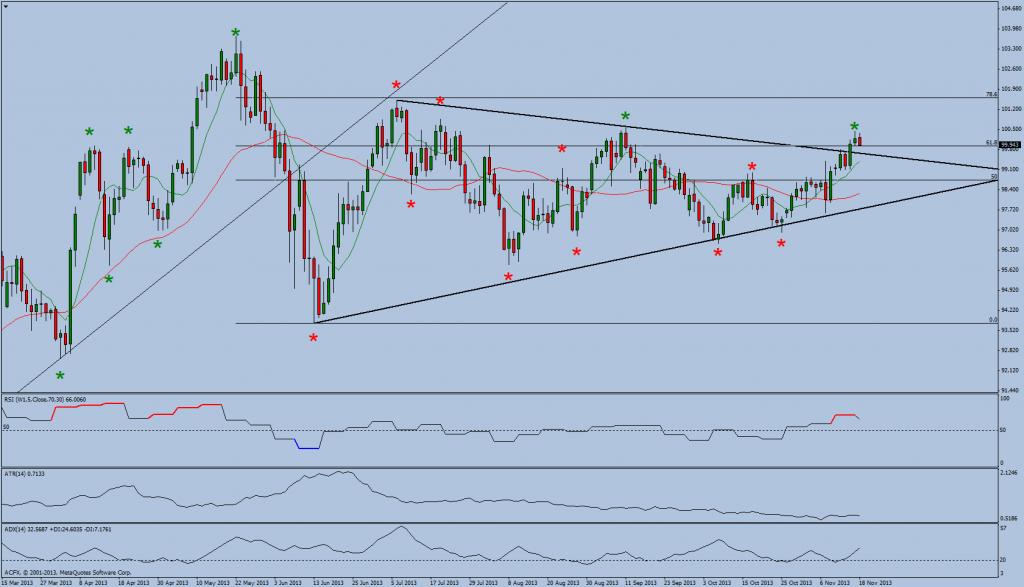
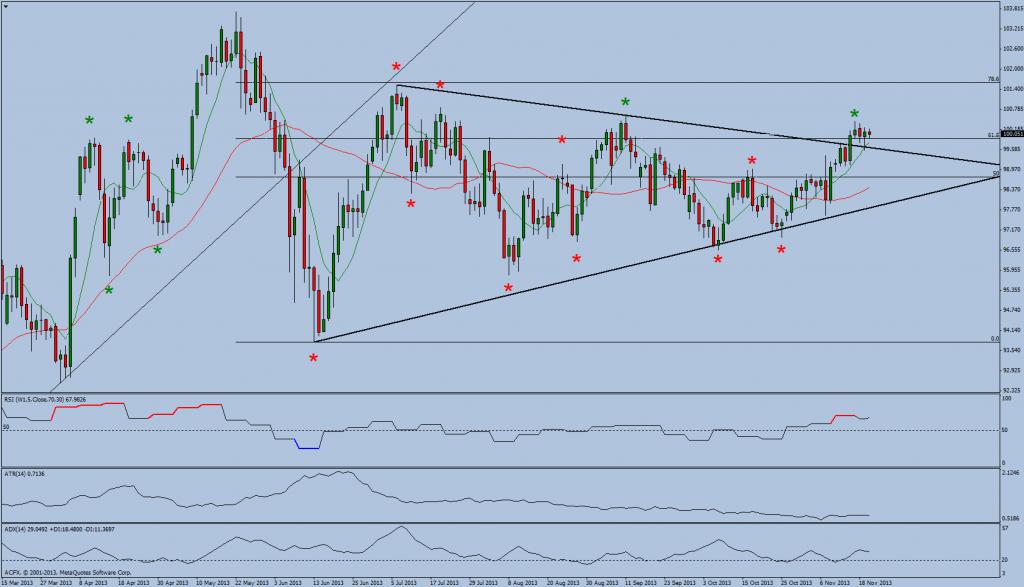
Daily Technical Analysis for USDJPY as at 12th November 2013
DAILY OVERVIEW
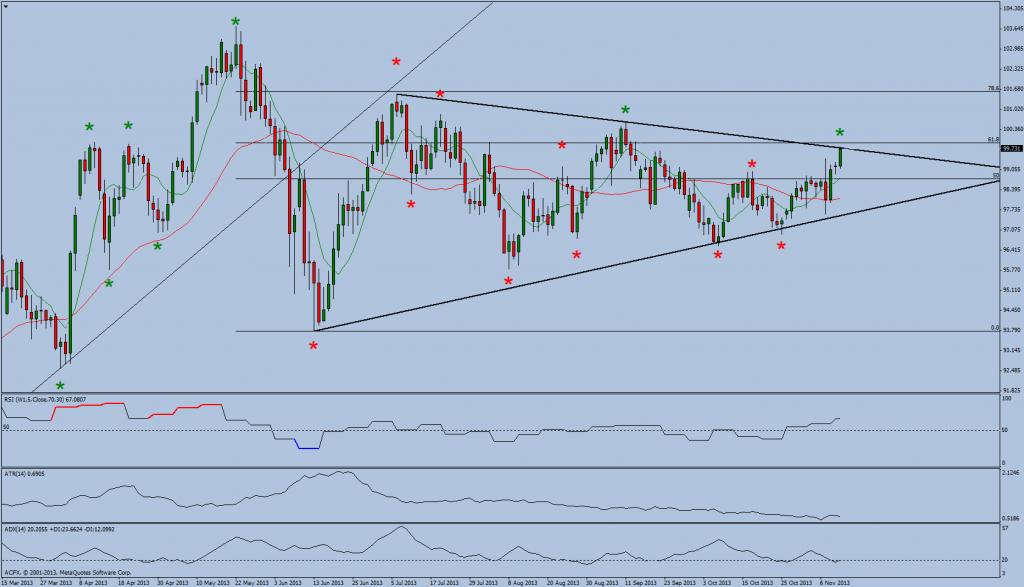
Trend : Up
Ambush Zone : -
Target 1 : -
Target 2 : -
Stop : -
Comments
Intraday
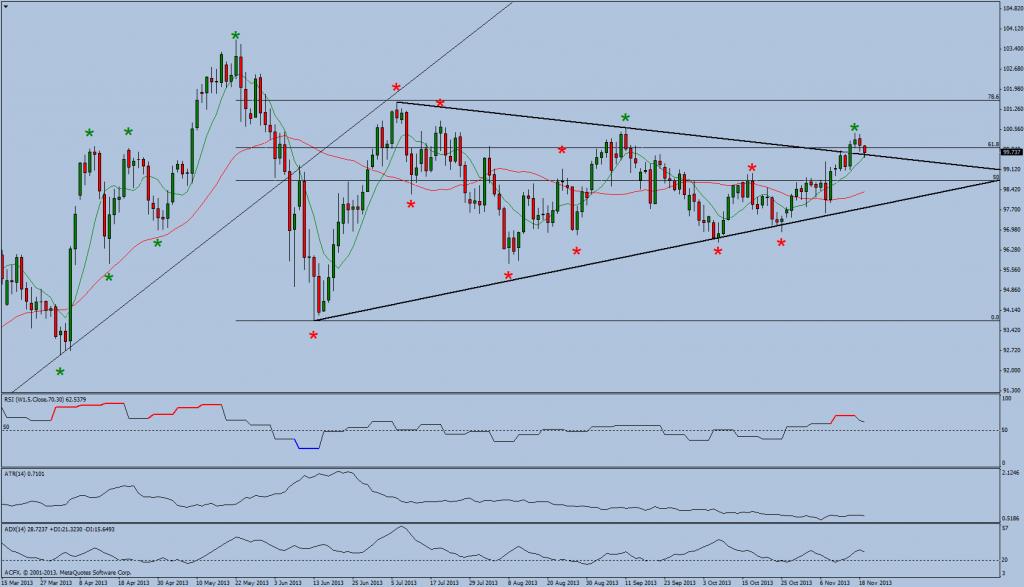
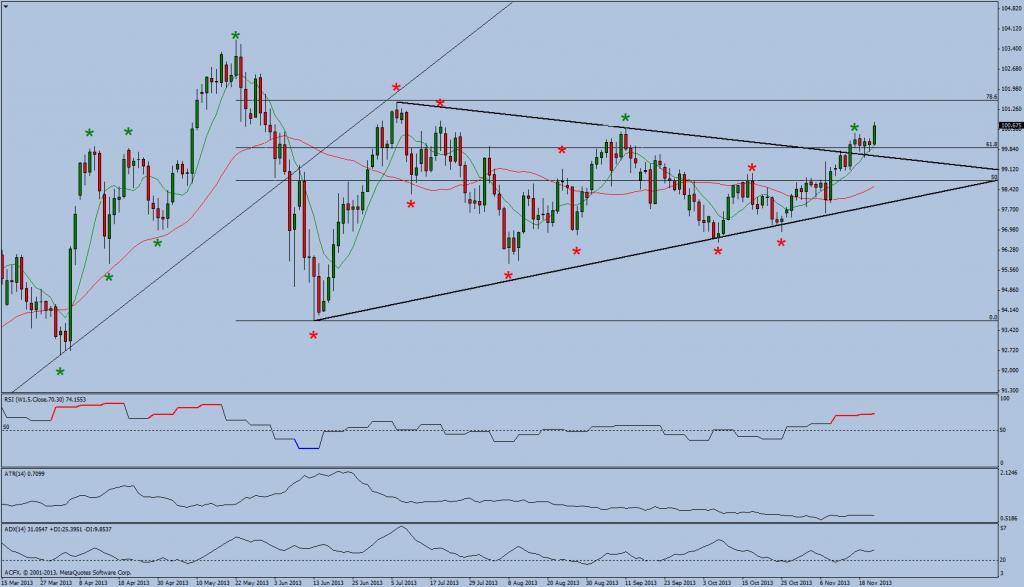
This morning session has exploded to the upside USDJPY touching the upper level of the converging triangle. The possible projected maximum daily ranges based upon current price being 99.09 to 99.80. As USDJPY is now trading at the extreme of its daily average range it would be interesting to see if the price action has enough energy left today to breach and sustain a move above the upper level of the converging triangle. A failure of an upside resistance break will open up the possibility of USDJPY trading a full average days range to the downside.
Trade ideas
1. With USDJPY having breached the prior swing high of the 17th October has changed the trend on a swing bias to up. The change of the daily trend now puts the swing bias in line with the weekly trend. This morning strong open puts a potential break of the converging triangle to the upside sharply into focus. However as a daily average range has already been traded the conservative plays are to either wait for a pullback possibly to the 8 period moving averages before deciding to participate on the long side or allow for a break of the converging triangle top and trade the pullback by using a choice of one’s preferred entry techniques.
2. However the overhead Fibonacci area that has offered good resistance will have to be overcome to allow for further upside. Now that the price action is trading at trend line resistance shorting opportunities may arise.
Scenario 1
As the dominant daily trend is up retracements into support such as the 8 period moving averages could potentially be viewed as buying opportunities.
Scenario 2
Alternatively both the Fibonacci resistance and upper trend line of the converging triangle could offer downside pressure that pushes USDJPY back to support with a swing low failure being the tipping point.
Daily Technical Analysis from ACFX 11/13/2013
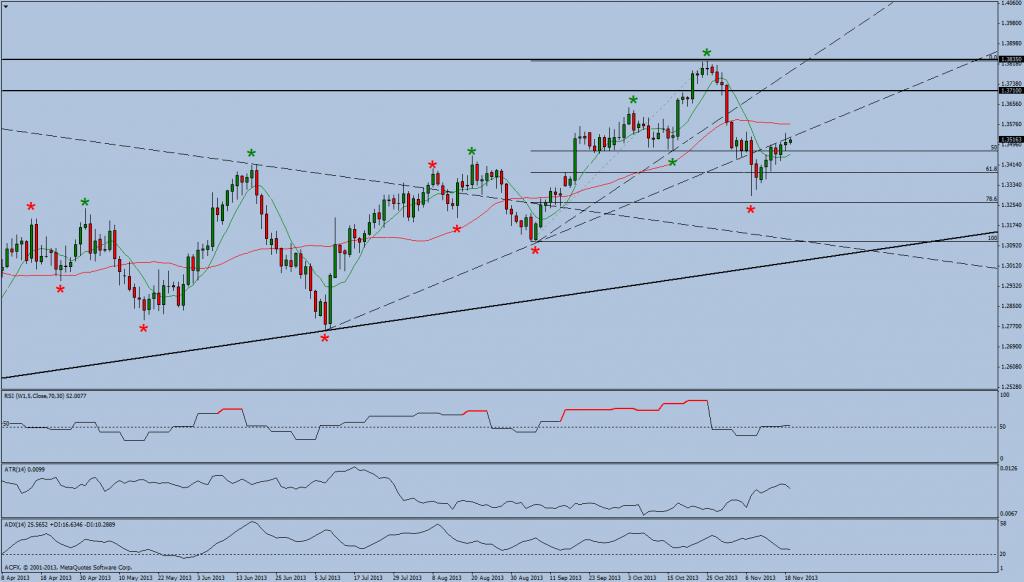
Daily Technical Analysis for EURUSD as at 13th November 20133
DAILY OVERVIEW
Trend : Down

Comments
Yesterday EURUSD after initially trading lower reversed its direction and closed above the range of the previous two days.
Market open focus
This morning after initially trading higher off the open EURUSD has now reversed the small gains it made. The possible projected maximum daily ranges based upon current price action are 1.3360 to 1.3520.
Today’s scenarios
1. EURUSD has traded up to the 8 period moving averages which is a value area where we are monitoring the possibility that the market once more rotates to the downside. A downside break could take EURUSD back into the previous two day’s trading range. The downside target for today is the area of yesterday’s low which is also in line the low of the projected maximum daily range at 1.3360.
2. Alternatively if EURUSD can penetrate and sustain a move above the 8 period moving averages there is potential for a move up to the bottom of the previously broken upward sloping trend line. This is a move of some 70 odd pips which is well within the upper limit of the projected maximum daily range at 1.3520.
Macro trade Ideas
1. The breach of the 16th October prior isolated low has changed the daily trend on a swing basis from up to down. This negative swing bias has been confirmed by multiple breaches of trend line support and the moving averages being layered negatively. Furthermore the RSI positive divergence has been invalidated by the 7th November break down. As the dominant daily trend based on swing analysis is down corrective pullbacks especially to resistance areas could be viewed as potential value areas where shorts could be added.
2. However the weekly time frame continues to be swing positive. Therefore there is a possibility that the down trend on the daily chart is nothing more than a corrective sell off that brings the price action into potential value areas where long term swing position buy trades could be executed. It should also be noted that EURUSD has traded into a large Fibonacci support area where price action stalled and bounced. With this in mind there is potential for a substantial upside move that could bring the daily trend back into line with the weekly trend. This scenario is valid as long as EURUSD can trade above the 6th September swing long which comes in around the 1.3100 area.
The Macro Technical Targets
The upside targets are 1.3470, 1.3530, 1.3650, and 1.3830. The downside targets are 1.3300, 1.3200, 1.3100 and 1.2750.
Daily Technical Analysis for GBPUSD as at 13th November 2013
DAILY OVERVIEW
Trend : Short
Comments
Yesterday GBPUSD traded through the low of the 16th October. Although GBPUSD in the afternoon did manage to reverse some of its losses and closed and above the low of the 16th of October yesterdays move did however breach a prior swing low which effectively changes the daily trend from up to down.
Market open focus
This morning GBPUSD has broken down from its European open and trading at the lows of its overnight range. The possible projected maximum daily ranges based upon current price action are 1.5815 to 1.5980.
Today’s scenarios
1. As I write GBP is trading in a very tight opening range around the 1.5880 to 1.5905 area. A down side break will need to test and breach yesterdays low which is some 35 pips away. If a sustained break of yesterdays low is achieved a move down to the lower level of one average daily range at 1.5815 could become a possibility.
2. Alternatively as GBPUSD is fairly extended from its averages there is potential for sideways to upside correction. The 8 period moving average and broken trend line support is some 115 pips away which is slightly above the upper limit of the projected maximum daily range of some 94 pips but this target is potentially achievable.
Macro trade ideas
1. Following yesterday’s breach of the 16th October swing low the trend on a daily swing basis has changed from up to down. This move was preceded by multiple trend line breaks and the averages switching their bias from up to down. With the price action having also broken through Fibonacci support the down side is now very much in focus on the daily time frame. Conservative entry methods as a means to participate in the down move could be to wait for possible pullbacks to key value areas such as the 8 period moving averages and trend line resistance.
2. Alternatively as the weekly time frame continues to have a positive swing bias and with the price action on the daily time frame very much extended from the averages there is a possibility of a substantial upside correction.
Marco Technical Targets
1.6260, 1.6170, 1.5890, 1.5715, 1.5570, 1.5720
Daily Technical Analysis for USDCHF as at 13th November 2013
DAILY OVERVIEW
Trend : Up
Comments
Yesterday USDCHF traded down to the 8 period moving averages as the price action moved away from trend line resistance. However the price action has for the fourth day opened up and trading within last Thursday’s range.
Market open focus
This morning USDCHF has traded within 10 pips either side of the European opening price and well with last night’s overnight range. The possible projected maximum daily ranges based upon current price being 0.9117 to 0.9220.
Today’s scenarios
1. This morning USDCHF has traded down to the 8 period moving averages which is a potential value area for longs to be placed. The target any such move will be the high of the 7th November which is slightly above one average daily range of about 70 pips.
2. Alternatively the failure to break above the high of the four day range could lead to a breach of the 8 period moving averages. A potential move down could hit the target of the broken downward sloping trend line.
Macro trade ideas
1. On a basis swing bases the trend is now positive following the breach of the prior isolated high. The moving averages are now layered positively and the breach of trend line resistance and the invalidation of Fibonacci resistance and the negative RSI divergence give further confirmation to the upside. The price action is somewhat consolidating within a four day range. Therefore we would like to see a break of Thursday’s high and trend line resistance so as to give further confirmation to the up move with the initial target being the 9th September swing high at 0.9455.
2. However the weekly time frame continues to point down. Therefore a breach of the 8 period moving averages puts into play a potential move to the 34 period moving averages
Macro technical levels
The macro technical levels are 0.9020 0.8930, 0.8570 and 0.9200.
Daily Technical Analysis for USDJPY as at 13th November 2013
DAILY OVERVIEW
Trend : Up
Comments
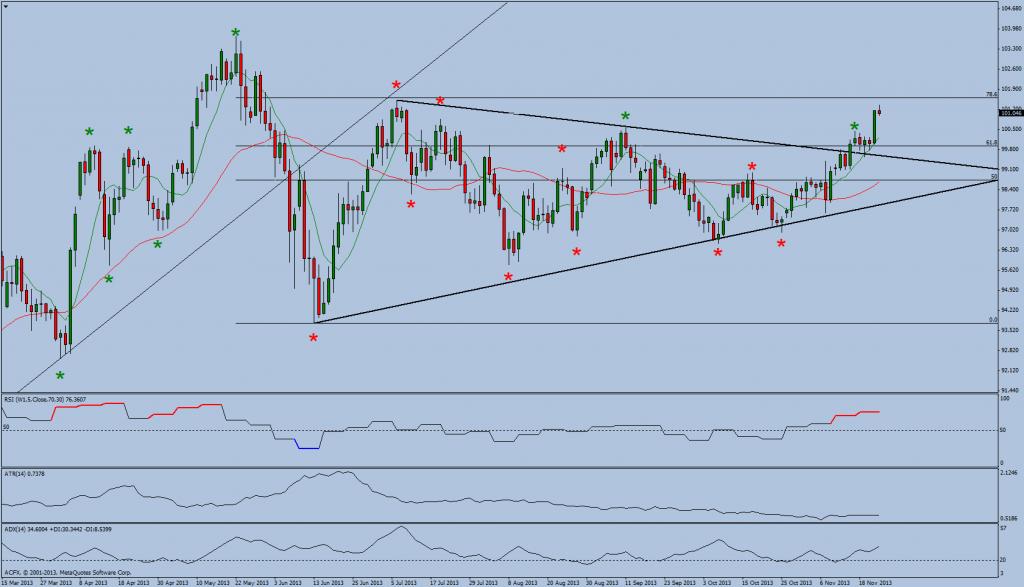
Yesterday USDJPY traded up to but stalled at converging triangle resistance. This move places the price action well within a possible Fibonacci resistance shorting area.
Market open focus
This morning USDJPY broke lower from the open of the European session only to find support at the bottom of the overnight range. The possible projected maximum daily ranges based upon current price are 99.00 to 100.00.
Today’s scenarios
1. A breach and sustained move above trend line resistance puts in play a move to the upper level of the projected maximum daily range which is at the psychological 100 level.
2. Alternatively both the Fibonacci resistance and upper trend line of the converging triangle could offer downside pressure that pushes USDJPY back to the 8 period moving averages. This would entail a move of some 80 pips which is slightly higher than the average daily range which is just under 70 pips.
Macro trade ideas
1. With USDJPY having breached the prior swing high of the 17th October has changed the trend on a swing bias to up. The change of the daily trend now puts the swing bias in line with the weekly trend. Yesterdays strong open puts a potential break of the converging triangle to the upside sharply into focus. However as the psychological 100 level is now in sight this barrier will have to be breached before both 100.60 and 101.50 swing levels can be taken out.
2. Alternatively downside pressure offered by the Fibonacci area and trend line resistance could offer a catalyst that pushes USDJPY back to trend line support.
Daily Technical Analysis from ACFX 11/14/2013
Daily Technical Analysis for EURUSD as at 14th November 2013
DAILY OVERVIEW
Trend : Down
Yesterday’s summary
Yesterday EURUSD traded up to previously broken trend line support and closed above the 8 period moving averages.
Market open focus
This morning EURUSD is trading slightly lower from its overnight high. The possible projected maximum daily ranges based upon current price action are 1.3397 to 1.3562.
Today’s scenarios
1. EURUSD has traded above to the 8 period moving averages which is a value area where we are monitoring the possibility that the market once more rotates to the downside. This is reinforced by the EURUSD now trading at previous broken support. A downside break could mean EURUSD test the low of yesterday’s trading range which is also in line with the low of today’s projected trading range.
2. Alternatively as EURUSD has penetrated and closed above the 8 period moving averages there is potential for a move to the 34 period moving averages. However the price action must first be able to penetrate current trend line resistance. Today’s upside target of the 34 period moving averages will require a move of some 125 pips which is slightly above the projected average daily range of 100 pips.
Macro trade Ideas
1. The breach of the 16th October prior isolated low has changed the daily trend on a swing basis from up to down. This negative swing bias has been confirmed by multiple breaches of trend line support and the moving averages being layered negatively. Furthermore the RSI positive divergence has been invalidated by the 7th November break down. As the dominant daily trend based on swing analysis is down corrective pullbacks especially to resistance areas could be viewed as potential value areas where shorts could be added.
2. However the weekly time frame continues to be swing positive. Therefore there is a possibility that the down trend on the daily chart is nothing more than a corrective sell off that brings the price action into potential value areas where long term swing position buy trades could be executed. It should also be noted that EURUSD has traded into a large Fibonacci support area where price action stalled and bounced. With this in mind there is potential for a substantial upside move that could bring the daily trend back into line with the weekly trend. This scenario is valid as long as EURUSD can trade above the 6th September swing long which comes in around the 1.3100 area.
The Macro Technical Targets
The upside targets are 1.3470, 1.3530, 1.3650, and 1.3830. The downside targets are 1.3300, 1.3200, 1.3100 and 1.2750.
Daily Technical Analysis for GBPUSD as at 14th November 2013
DAILY OVERVIEW
Trend : Short
Yesterday’s summary
Yesterday GBPUSD had a strong bounce following its penetration of the low of the 16th October. The corrective rally took GBPUSD up to its averages and on its way penetrated a previously broken up trend line. GBPUSD finally closed at a fairly recently formed downward sloping trend line.
Market open focus
This morning GBPUSD is trading slightly lower from its overnight high. The possible projected maximum daily ranges based upon current price action are 1.5960 to 1.6125.
Today’s scenarios
1. GBP is currently trading in between the averages and at a downward sloping trend line. The area of the averages is a potential value area where shorts could possibly be entered. As the average true range is some 100 pips a down side break has the potential to erase up to 50% of yesterdays corrective rally.
2. Alternatively as GBPUSD has traded up to the averages, a break above them could see GBPUSD make an attempt at breaching the minor high pivot of the 6th November at 1.6117. This target is well inside the upper limit of today’s projected daily range.
Macro trade ideas
1. Following the breach of the 16th October swing low the trend on a daily swing basis has changed from up to down. This move was preceded by multiple trend line breaks and the averages switching their bias from up to down. With the price action having also broken through Fibonacci support the down side is now very much in focus on the daily time frame. Conservative entry methods as a means to participate in the down move could be to wait for possible pullbacks to key value areas such as the 8 period moving averages and trend line resistance.
2. Alternatively as the weekly time frame continues to have a positive swing bias and with the price action on the daily time frame very much extended from the averages there is a possibility of a substantial upside correction.
Marco Technical Targets
1.6260, 1.6170, 1.5890, 1.5715, 1.5570, 1.5720
Daily Technical Analysis for USDCHF as at 14th November 2013
DAILY OVERVIEW
Trend : Up
Comments
Yesterday USDCHF traded down to the 8 period moving averages as the price action moved away from trend line resistance. However the price action has for the fifth day opened up and trading within last Thursday’s range.
Market open focus
This morning CHFUSD is trading higher from its overnight low and is bouncing off both the 8 period moving averages as previously broken trend line resistance. The possible projected maximum daily ranges based upon current price action are 0.9100 to 0.9191.
Today’s scenarios
1. This morning USDCHF is finding support at the 8 period moving averages which is a potential value area for longs to be placed. The ultimate target for any such move will be the high of the 7th November which is two average daily ranges away from the overnight low. Therefore a breach of yesterday’s high might be a more conservative and achievable target.
2. Alternatively an intraday downside reversal could see USDCHF attempt to breach the low of the 7th November being the lower limit of the 5 day trading range.
Macro trade ideas
1. On a basis swing bases the trend is now positive following the breach of the prior isolated high. The moving averages are now layered positively and the breach of trend line resistance and the invalidation of Fibonacci resistance and the negative RSI divergence give further confirmation to the upside. The price action is somewhat consolidating within a four day range. Therefore we would like to see a break of Thursday’s high and trend line resistance so as to give further confirmation to the up move with the initial target being the 9th September swing high at 0.9455.
2. However the weekly time frame continues to point down. Therefore a breach of the 8 period moving averages puts into play a potential move to the 34 period moving averages
Macro technical levels
The macro technical levels are 0.9020 0.8930, 0.8570 and 0.9200.
Daily Technical Analysis for USDJPY as at 14th November 20133
DAILY OVERVIEW
Trend : Up

Yesterday’s summary
Yesterday USDJPY traded lower off converging triangle resistance as it corrected back down to the 8 period moving averages.
Market open focus
This morning USDJPY is trading higher from its overnight low as it attempts to break above trend line resistance. The possible projected maximum daily ranges based upon current price action are 99.00 to 100.00.
Today’s scenarios
1. The strong open has had the result that USDJPY has already traded an average daily range. This leads to two possibilities for the long side. That this morning’s move will soon pause as it runs out of energy or this will be a stellar up day for this currency pair. As posted yesterday a breach and sustained move above trend line resistance puts into play a move to the upper level of the projected maximum daily range which is at the psychological 100 level.
2. Alternatively both the Fibonacci resistance and upper trend line of the converging triangle could offer downside pressure that pushes USDJPY back to the 8 period moving averages. This would entail a move of some 80 pips which is slightly higher than the average daily range which is just under 70 pips.
Macro trade ideas
1. With USDJPY having breached the prior swing high of the 17th October has changed the trend on a swing bias to up. The change of the daily trend now puts the swing bias in line with the weekly trend. This morning’s strong open puts a potential break of the converging triangle to the upside sharply into focus. However as the psychological 100 level is now in sight this barrier will have to be breached before both 100.60 and 101.50 swing levels can be taken out.
2. Alternatively downside pressure offered by the Fibonacci area and trend line resistance could offer a catalyst that pushes USDJPY back to trend line support.
Daily Technical Analysis from ACFX 11/15/2013
Daily Technical Analysis for EURUSD as at 15th November 2013
DAILY OVERVIEW
Trend : Down
Yesterday’s summary
Yesterday EURUSD once again traded up to but was unable to breach previously broken trend line support but did manage however to closed above the 8 period moving averages.
Market open focus
EURUSD has moved 44 pips lower from its overnight high and currently trading within a 20 pip congestion area and in the middle of yesterdays low to high range. I am currently monitoring a possible early morning up or downside break to the area of yesterdays previous high or low. The possible projected maximum daily ranges based upon current price action are 1.3388 to 1.3518.
Today’s scenarios
1. EURUSD has traded above to the 8 period moving averages which is a value area where I am monitoring the possibility that the market once more rotates to the downside. This is reinforced by the EURUSD now trading at previous broken support. A downside break could mean EURUSD test the low of the 13th November trading range which is also in line with the low of today’s projected trading range.
2. Alternatively as EURUSD has penetrated and closed above the 8 period moving averages there is potential for a move to the 34 period moving averages. However the price action must first be able to penetrate current trend line resistance. Today’s upside target of the 34 period moving averages will require a move from yesterday’s low of some 170 pips which allowing for an average daily range of 100 pips might not be achievable.
Macro trade Ideas
1. The breach of the 16th October prior isolated low has changed the daily trend on a swing basis from up to down. This negative swing bias has been confirmed by multiple breaches of trend line support and the moving averages being layered negatively. Furthermore the RSI positive divergence has been invalidated by the 7th November break down. As the dominant daily trend based on swing analysis is down corrective pullbacks especially to resistance areas could be viewed as potential value areas where shorts could be added.
2. However the weekly time frame continues to be swing positive. Therefore there is a possibility that the down trend on the daily chart is nothing more than a corrective sell off that brings the price action into potential value areas where long term swing position buy trades could be executed. It should also be noted that EURUSD has traded into a large Fibonacci support area where price action stalled and bounced. With this in mind there is potential for a substantial upside move that could bring the daily trend back into line with the weekly trend. This scenario is valid as long as EURUSD can trade above the 6th September swing long which comes in around the 1.3100 area.
The Macro Technical Targets
The upside targets are 1.3470, 1.3530, 1.3650, and 1.3830. The downside targets are 1.3300, 1.3200, 1.3100 and 1.2750.
Daily Technical Analysis for GBPUSD as at 15th November 2013
DAILY OVERVIEW
Trend : Short
Yesterday’s summary
Yesterday after initially breaking down GBPUSD reversed off its lows and closed the day higher. In the process GBPUSD also penetrated and closed above the downward sloping trend line and at the 34 period moving averages.
Market open focus
This morning GBPUSD had traded some 50 pips lower from its overnight high but this move has since retraced with the price action slightly beneath yesterdays high and above this morning’s open. Furthermore GBPUSD is currently trading above the 34 period moving averages.
The possible projected maximum daily ranges based upon current price action are 1.5996 to 1.6091.
Today’s scenarios
1. I am currently monitoring the price action as it now trades near the previous day’s high resistance area. As we have already had a good 110 plus move from yesterday’s low which exceeds the current average true range reading it would be interesting to see if there GBPUSD has enough energy left to trade higher but the possibility of a further 70 pips to the upside is traded today from the current price of 1.6085 should not be ruled out.
2. However on the flip side GBPUSD has had a good up move. Therefore a failure to sustain a break above yesterday’s high could see GBPUSD once again breach trend line support but this time to the down side with the daily target being yesterday’s low at 1.5987.
Macro trade ideas
1. Following the breach of the 16th October swing low the trend on a daily swing basis has changed from up to down. This move was preceded by multiple trend line breaks and the averages switching their bias from up to down. With the price action having also broken through Fibonacci support the down side is now very much in focus on the daily time frame. Conservative entry methods as a means to participate in the down move could be to wait for possible pullbacks to key value areas such as the 8 period moving averages and trend line resistance.
2. Alternatively as the weekly time frame continues to have a positive swing bias and with the price action on the daily time frame very much extended from the averages there is a possibility of a substantial upside correction.
Marco Technical Targets
1.6260, 1.6170, 1.5890, 1.5715, 1.5570, 1.5720
Daily Technical Analysis for USDCHF as at 15th November 2013
DAILY OVERVIEW
Trend : Up

Yesterday’s summary
Yesterday USDCHF reversed off it’s the previous day and its early morning low and traded substantially higher before collapsing at lunch time and paring most of its gains. However USDCHF did eventually close marginally higher.
The price action effectively has been whipping around the 8 period moving averages and bouncing of trend line support for the past two days.
Market open focus
This morning USDCHF has been trading within a tight 15 pip congestion range and some 45 pips above yesterday afternoons low and 15 pips beneath yesterday’s high. A break above or beneath this congestion area should quickly lead to a move into previous day’s support and resistance.
The possible projected maximum daily ranges based upon current price action are 0.9113 to 0.9205.
Today’s scenarios
1. This morning USDCHF continues to trade around the 8 period moving averages which a potential value area is for longs to be placed. A break above this morning congestion area will quickly lead to move into the area of the previous day’s high being 0.9176/0.9188. This area my initial point of interest as the previous day’s high will need to broken so as to allow for an upside move to happen. Allowing for the average true range calculation there is potential for at least a 30 pip move from the current level at 0.9172.
2. Alternatively break beneath this morning congestion zone puts in play a potential move to the previous days low.
Macro trade ideas
1. On a basis swing bases the trend is now positive following the breach of the prior isolated high. The moving averages are now layered positively and the breach of trend line resistance and the invalidation of Fibonacci resistance and the negative RSI divergence give further confirmation to the upside. The price action is somewhat consolidating within a four day range. Therefore we would like to see a break of Thursday’s high and trend line resistance so as to give further confirmation to the up move with the initial target being the 9th September swing high at 0.9455.
2. However the weekly time frame continues to point down. Therefore a sustained breach of the 8 period moving averages puts into play a potential move to the 34 period moving averages
Macro technical levels
The macro technical levels are 0.9020 0.8930, 0.8570 and 0.9200.
Daily Technical Analysis from ACFX 11/18/2013
Daily Technical Analysis for EURUSD as at 15th November 2013
DAILY OVERVIEW
Trend : Down
Yesterday’s summary
Friday EURUSD once again traded up to but was unable to breach previously broken trend line support but continues to trade above the 8 period moving averages.
Market open focus
EURUSD had attempted to trade under Friday’s high but has so far been unable to sustain this move. I am currently monitoring an initial attempt to breach Friday’s high. The possible projected maximum daily ranges based upon current price action are 1.3400 to 1.3580.
Today’s scenarios
1. EURUSD has traded above to the 8 period moving averages which is a value area where I am monitoring the possibility that the market once more rotates to the downside. This is reinforced by the EURUSD now trading at previous broken support. A downside break could mean EURUSD test the low of the 14th November trading range which is also just above the low of today’s projected trading range.
2. Alternatively as EURUSD has penetrated and closed above the 8 period moving averages there is potential for a move to the 34 period moving averages. However the price action must first be able to penetrate current trend line resistance. Today’s upside target of the 34 period moving averages will require a move from today’s low of some 104 pips which is in line with the high of today’s projected daily range.
Macro trade Ideas
1. The breach of the 16th October prior isolated low has changed the daily trend on a swing basis from up to down. This negative swing bias has been confirmed by multiple breaches of trend line support and the moving averages being layered negatively. Furthermore the RSI positive divergence has been invalidated by the 7th November break down. As the dominant daily trend based on swing analysis is down corrective pullbacks especially to resistance areas could be viewed as potential value areas where shorts could be added.
2. However the weekly time frame continues to be swing positive. Therefore there is a possibility that the down trend on the daily chart is nothing more than a corrective sell off that brings the price action into potential value areas where long term swing position buy trades could be executed. It should also be noted that EURUSD has traded into a large Fibonacci support area where price action stalled and bounced. With this in mind there is potential for a substantial upside move that could bring the daily trend back into line with the weekly trend. This scenario is valid as long as EURUSD can trade above the 6th September swing long which comes in around the 1.3100 area.
The Macro Technical Targets
The upside targets are 1.3470, 1.3530, 1.3650, and 1.3830. The downside targets are 1.3300, 1.3200, 1.3100 and 1.2750.
Daily Technical Analysis for GBPUSD as at 18th November 2013
DAILY OVERVIEW
Trend : Short

Yesterday’s summary
Friday GBPUSD initially traded lower off the previous day’s high only for the down move to stall and consolidate before finally breaking higher later in the London session. GBPUSD closed the minor swing high of the 6th November and above both the downward sloping trend line and at the 34 period moving averages.
Market open focus
This morning GBPUSD has breached Friday’s high but has just fallen back into the early morning range.
The possible projected maximum daily ranges based upon current price action are 1.6040 to 1.6145.
Today’s scenarios
1. I am currently monitoring the price action as it now trades near the Friday’s high resistance area. The move so far off Friday’s low is some 97 pips. As the current average daily true range reading is around 100 pips it would be interesting to see if GBPUSD can break and sustain a move Friday’s high with the initial target being the large over head multi month trend line. A move to this level from the current price of 1.6130 would need a move of some 100 pips which might not be achievable today.
2. However on the flip side GBPUSD has had a good up move. Therefore a failure to sustain a break above Friday’s high could see GBPUSD once again trade back to trend line support.
Macro trade ideas
1. Following the breach of the 16th October swing low the trend on a daily swing basis has changed from up to down. This move was preceded by multiple trend line breaks and the averages switching their bias from up to down. With the price action having also broken through Fibonacci support the down side is now very much in focus on the daily time frame. Conservative entry methods as a means to participate in the down move could be to wait for possible pullbacks to key value areas such as the 8 period moving averages and trend line resistance.
2. Alternatively as the weekly time frame continues to have a positive swing bias and with the price action on the daily time frame very much extended from the averages there is a possibility of a substantial upside correction.
Marco Technical Targets
1.6260, 1.6170, 1.5890, 1.5715, 1.5570, 1.5720
Daily Technical Analysis for USDCHF as at 18th November 2013
DAILY OVERVIEW
Trend : Up
Yesterday’s summary
Friday USDCHF initially traded up and traded above the previous day’s high only for the price action to reverse aggressively beneath the previous session intraday low. However USDCHF did experience a bounce off its low and finally closed just beneath the 8 period moving averages
Market open focus
This morning USDCHF has traded some 44 pips lower off its morning high as it moves towards prior broken trend line support.
The possible projected maximum daily ranges based upon current price action are 0.9090 to 0.9190.
Today’s scenarios
1. Friday’s market negativity has continued into this morning’s session. If trend line can be breached today’s downside target is the 34 period moving averages which is slightly above the lower limit of the current daily average range.
2. Alternatively support can hold above the prior broken trend line there is a possibility that USDCHF trades back up to the previous session high.
Macro trade ideas
1. On a basis swing bases the trend is now positive following the breach of the prior isolated high. The moving averages are now layered positively and the breach of trend line resistance and the invalidation of Fibonacci resistance and the negative RSI divergence give further confirmation to the upside. The price action is somewhat consolidating within a four day range. Therefore we would like to see a break of 13th November high and trend line resistance so as to give further confirmation to the up move with the initial target being the 9th September swing high at 0.9455.
2. However the weekly time frame continues to point down. Therefore a sustained breach of the 8 period moving averages puts into play a potential move to the 34 period moving averages
Macro technical levels
The macro technical levels are 0.9020 0.8930, 0.8570 and 0.9200.
Daily Technical Analysis for USDJPY as at 15th November 2013
DAILY OVERVIEW
Trend : Up
Yesterday’s summary
Friday USDJPY opened strongly as it quickly broke above the previous sessions high. Apart from a minor early morning corrective pull back the upward momentum continued and at one point looked like breaching the 11th September swing high. This attempted however failed as USDJPY moderately corrected late in the London session
Market open focus
This morning USDJPY is trading a little under 50 pips lower from the Friday’s high which is also near to the previous session low area. We are monitoring this important intraday swing level for signs of support.
The possible projected maximum daily ranges based upon current price action are 99.70 to 100.60.
Today’s scenarios
1. I am currently monitoring if USDJPY can find support and bounce off the previous session intraday low. This swing point is also in the area of the important 100 level with the current market price being 99.97. If support does hold I will monitor a possible up move at least to Friday’s high and then for USDJPY to make a further attempt at breaching the t11th September swing high level of 100.61. This move is well with the upper limit of average projected daily range.
2. Alternatively the 100 level is offering some resistance. If the previous sessions low is breached there is a possibility that USDJPY trades back to the top of broken converging triangle. This move is within the lower limit of the average projected daily range.
Macro trade ideas
1. With USDJPY having breached the prior swing high of the 17th October has changed the trend on a swing bias to up. The change of the daily trend now puts the swing bias in line with the weekly trend. The breach of both the downward sloping trend line and significant 100 level now puts in play potential moves to both 100.60 and 101.50 swing levels .
2. Alternatively failure to sustain a move above the downward sloping trend line and significant 100 level added to the downside pressure offered by the Fibonacci area could lead to USDJPY trading back deep into the prior triangle pattern.
Daily Technical Analysis from ACFX 11/19/2013
Daily Technical Analysis for EURUSD as at 19th November 2013
DAILY OVERVIEW
Trend : Down
Yesterday’s summary
Yesterday EURUSD did manage to breach the over head trend line resistance only for the price action to fall back and close higher but under this level.
Market open focus
This morning EURUSD has traded down some 50 pips from yesterday’s high but is trading well above yesterday’s low. I am currently monitoring if EURUSD will break higher and in gear with the intraday trend.
The possible projected maximum daily ranges based upon current price action are 1.3439 to 1.3596.
Today’s scenarios
1. EURUSD has traded above to the 8 period moving averages which is a value area where I am monitoring the possibility that the market once more rotates to the downside. This is reinforced by the EURUSD now trading at previous broken support. A downside break could mean EURUSD test the low of the 15th November trading range which is in line with the low of today’s projected trading range.
2. Alternatively as EURUSD has penetrated and closed above the 8 period moving averages there is potential for a move to the 34 period moving averages. However the price action must first be able to penetrate current trend line resistance. Today’s upside target of the 34 period moving averages will require a move from today’s low of some 70 pips which is in within the upper limit of today’s projected high of the daily range.
Macro trade Ideas
1. The breach of the 16th October prior isolated low has changed the daily trend on a swing basis from up to down. This negative swing bias has been confirmed by multiple breaches of trend line support and the moving averages being layered negatively. Furthermore the RSI positive divergence has been invalidated by the 7th November break down. As the dominant daily trend based on swing analysis is down corrective pullbacks especially to resistance areas could be viewed as potential value areas where shorts could be added.
2. However the weekly time frame continues to be swing positive. Therefore there is a possibility that the down trend on the daily chart is nothing more than a corrective sell off that brings the price action into potential value areas where long term swing position buy trades could be executed. It should also be noted that EURUSD has traded into a large Fibonacci support area where price action stalled and bounced. With this in mind there is potential for a substantial upside move that could bring the daily trend back into line with the weekly trend. This scenario is valid as long as EURUSD can trade above the 6th September swing long which comes in around the 1.3100 area.
The Macro Technical Targets
The upside targets are 1.3470, 1.3530, 1.3650, and 1.3830. The downside targets are 1.3300, 1.3200, 1.3100 and 1.2750.
Daily Technical Analysis for GBPUSD as at 19th November 2013
DAILY OVERVIEW
Trend : Short
Yesterday’s summary
Yesterday GBPUSD experience a narrow range day with some 70 odd pips separating the high to the low. This is well below the daily average of 100 pips. GBPUSD continues to trade above the swing high of the 6th November and above both the downward sloping trend line and at the 34 period moving averages.
Market open focus
This morning GBPUSD has open and is trading in the middle of yesterday’s range. We are monitoring a possible initial move to the high or low of this range.
The possible projected maximum daily ranges based upon current price action are 1.6050 to 1.6180.
Today’s scenarios
1. I am currently monitoring the price action as it now trades in between yesterday’s range. As this morning’s range is fairly tight an upside breach of the overnight high of 1.6148 could see GBPUSD make an attempt at reaching the multi month downward sloping trend line. However this would entail a move of 140 odd pips from the overnight low and therefore this might not be achievable during today’s session.
2. Alternatively a break beneath yesterday’s low could see GBPUSD make an attempt at breaching trend line support. This move will be well within the projected daily range.
Macro trade ideas
1. Following the breach of the 16th October swing low the trend on a daily swing basis has changed from up to down. This move was preceded by multiple trend line breaks and the averages switching their bias from up to down. With the price action having also broken through Fibonacci support the down side is now very much in focus on the daily time frame. Conservative entry methods as a means to participate in the down move could be to wait for possible pullbacks to key value areas such as the 8 period moving averages and trend line resistance.
2. Alternatively as the weekly time frame continues to have a positive swing bias and with the price action on the daily time frame very much extended from the averages there is a possibility of a substantial upside correction.
Marco Technical Targets
1.6260, 1.6170, 1.5890, 1.5715, 1.5570, 1.5720
Daily Technical Analysis for USDCHF as at 19th November 2013
DAILY OVERVIEW
Trend : Up
Yesterday’s summary
Yesterday USDCHF traded and closed beneath Friday’s low following its attempt to breach trend line support. This move has taken USDCHF back into the area of between both positively layered averages.
Market open focus
This morning USDCHF is trading within yesterday’s New York range in what has so far been a quiet open.
The possible projected maximum daily ranges based upon current price action are 0.9070 to 0.9165.
Today’s scenarios
1. With the price action now trading within moving average support and at trend line support a break above the overnight high of 0.9142 could see USDCHF attempt to trade up to the 15th November high.
2. Alternatively a breach of the New York session low of 0.9095 could see USDCHF breach trend line support and trade down to the 34 period moving averages.
Macro trade ideas
1. On a basis swing bases the trend is now positive following the breach of the prior isolated high. The price action is trading within the positively layered moving averages and above trend line support after what has been a substantial downside correction. An upside break would have initial target of the 9th September swing high at 0.9455.
2. However the weekly time frame continues to point down. Therefore a sustained breach of the 8 period moving averages puts into play a potential move to the 34 period moving averages
Macro technical levels
The macro technical levels are 0.9020 0.8930, 0.8570 and 0.9200.
Daily Technical Analysis for USDJPY as at 19th November 2013
DAILY OVERVIEW
Trend : Up
Yesterday’s summary
Yesterday USDJPY was unable to continue with its upward momentum as it broke beneath Friday’s low. However late in the session USDJPY did manage to correct somewhat and in the process the price action managed to close marginally above Friday’s low.
Market open focus
This morning USDJPY has once again resumed its downward correction and has traded some 25 pips beneath yesterday’s low. I am monitoring price action to see if it can sustain a move beneath yesterday’s low.
The price action has move some 88 pips lower off the 15th November high. This exceeds a daily true range projection by some 18 pips. Therefore USDJPY may find it needs to retrace somewhat before moving lower. The upside project is 100.25.
Today’s scenarios
1. I am currently monitoring if USDJPY can bounce off the trend line support with a resulting move taking the price action back up to at least the 100 level.
2. Alternatively a failure to sustain a move above the previous day’s low could see USDJPY trade back down to the area of the 13th November low at 99.10.
Macro trade ideas
1. With USDJPY having breached the prior swing high of the 17th October has changed the trend on a swing bias to up. The change of the daily trend now puts the swing bias in line with the weekly trend. The breach of both the downward sloping trend line and significant 100 level now puts in play potential moves to both 100.60 and 101.50 swing levels.
2. Alternatively failure to sustain a move above the downward sloping trend line and significant 100 level added to the downside pressure offered by the Fibonacci area could lead to USDJPY trading back deep into the prior triangle pattern.
Daily Technical Analysis from ACFX 11/20/2013
Daily Technical Analysis for EURUSD as at 20th November 2013
Yesterday’s summary
Yesterday European open was initially positive as EURUSD traded marginally above the previous day’s high. However EURUSD reversed during the early morning session and tested but did not breach the previous day’s low. The holding of support gave EURUSD an opportunity to build a base from where it once again tested and this time breached intraday resistance. Ultimately EURUSD closed the day up and above trend line resistance.
Market open focus
The overnight session has seen EURUSD trade 33 pips above the previous day’s high. However the price action found resistance at the 34 period moving averages and has since retraced most of its gains and is now trading just above intraday support.
We are monitoring the price action around the overnight 1hour pivot high for an indication of today’s possible market direction with potential longs above 1.3580 and shorts beneath 1.3530.
The possible projected maximum daily ranges based upon current price action are 1.3480 to 1.3580.
Today’s scenarios
1. EURUSD has traded up to but found resistance at the 34 period moving averages. If the price action can hold beneath this average there is a possibility that EURUSD trades down to the previous day’s low which coincides with the 8 period moving averages.
2. Alternatively as EURUSD has now made an initial attempt to penetrate the 34 period moving averages so early in the session there is a possibility that a further attempt is made today to breach this level. However the move up from yesterday’s low are some 90 pips which equate to us around 1 daily average range. Therefore is a question mark on how much more energy EURUSD has left to continue the up thrust from here.
Macro trade Ideas
1. The breach of the 16th October prior isolated low has changed the daily trend on a swing basis from up to down. This negative swing bias has been confirmed by multiple breaches of trend line support and the moving averages being layered negatively. As the dominant daily trend based on swing analysis is down corrective pullbacks especially to resistance areas could be viewed as potential value areas where shorts could be added.
2. However the weekly time frame continues to be swing positive. Therefore there is a possibility that the down trend on the daily chart is nothing more than a corrective sell off that brings the price action into potential value areas where long term swing position buy trades could be executed. It should also be noted that EURUSD has traded into a large Fibonacci support area where price action stalled and bounced. With this in mind there is potential for a substantial upside move that could bring the daily trend back into line with the weekly trend. This scenario is valid as long as EURUSD can trade above the 6th September swing long which comes in around the 1.3100 area.
The Macro Technical Targets
The upside targets are 1.3470, 1.3530, 1.3650, and 1.3830. The downside targets are 1.3300, 1.3200, 1.3100 and 1.2750.
Daily Technical Analysis for GBPUSD as at 19th November 2013

Yesterday’s summary
Yesterday GBPUSD experience another narrow range day with some 70 odd pips separating the high to the low. This is well below the daily average of 100 pips. GBPUSD continues to trade above the swing high of the 6th November and above both the downward sloping trend line and at the 34 period moving averages.
Market open focus
This morning GBPUSD has opened mixed and is trading in the middle of yesterday’s range.
We are monitoring a possible initial break of the high or low of this range.
The possible projected maximum daily ranges based upon current price action are 1.6040 to 1.6160.
Today’s scenarios
1. I am currently monitoring the price action as it now trades in between yesterday’s range. As this morning’s range is fairly tight an upside breach of the 18th November high of 1.6148 could see GBPUSD make an attempt at reaching the multi month downward sloping trend line. However this would entail a move of 140 odd pips from the overnight low and therefore this might not be achievable during today’s session.
2. Alternatively a break beneath yesterday’s low could see GBPUSD make an attempt at breaching trend line support. This move will be well within the projected daily range.
Macro trade ideas
1. Following the breach of the 16th October swing low the trend on a daily swing basis has changed from up to down. This move was preceded by multiple trend line breaks and the averages switching their bias from up to down. With the price action having also broken through Fibonacci support the down side is now very much in focus on the daily time frame. Conservative entry methods as a means to participate in the down move could be to wait for possible pullbacks to key value areas such as the 8 period moving averages and trend line resistance.
2. Alternatively as the weekly time frame continues to have a positive swing bias and with the price action on the daily time frame very much extended from the averages there is a possibility of a substantial upside correction.
Marco Technical Targets
1.6260, 1.6170, 1.5890, 1.5715, 1.5570, 1.5720
Daily Technical Analysis for USDCHF as at 20th November 2013
Yesterday’s summary
Yesterday USDCHF open mixed but then experienced a modest up thrust but which failed to breach the prior session high. During the New York session USDCHF began to weaken and traded down and in the process breached and closed beneath the prior session low.
Market open focus
This morning USDCHF continued to follow the prior sessions lead and traded lower but has found support at the 34 period moving averages.
The possible projected maximum daily ranges based upon current price action are 0.9075 to 0.9145.
Today’s scenarios
1. USDCHF is now trading beneath yesterday’s session low but is finding support at the 34 period moving averages. If support can hold there is a possibility that USDCHF trades up to the previous sessions high.
2. Alternatively a breach of the overnight low could see USDCHF breach the 34 period moving averages.
Macro trade ideas
1. On a basis swing bases the trend is now positive following the breach of the prior isolated high. The price action is trading within the positively layered moving averages and above trend line support after what has been a substantial downside correction. An upside break would have initial target of the 9th September swing high at 0.9455.
2. However the weekly time frame continues to point down. Therefore a sustained breach of the 8 period moving averages puts into play a potential move to the 34 period moving averages.
Macro technical levels
The macro technical levels are 0.9020 0.8930, 0.8570 and 0.9200.
Daily Technical Analysis for USDJPY as at 20th November 2013
Yesterday’s summary
Yesterday USDJPY traded down to the 8 period moving averages where it found support at 99.56. Off support USDJPY traded higher and this led to an intraday one hour swing low pivot being printed. The up move off support continued with USDJPY printing an intraday higher low and high higher sequence. USDJPY finally closed day above the prior days high.
Market open focus
This morning USDJPY has opened and trading lower from yesterday’s session high. I am monitoring a potential move down to yesterday’s session intraday support level.
The possible projected maximum daily ranges based upon current price action are 99.50 to 100.60.
Today’s scenarios
1. I am currently monitoring if USDJPY can bounce off the trend line support with a resulting move taking the price action back up to at least the 100.60 level.
2. Alternatively a failure to sustain a move above the previous day’s high could see USDJPY trade back down yesterday’s session low.
Macro trade ideas
1. With USDJPY having breached the prior swing high of the 17th October has changed the trend on a swing bias to up. The change of the daily trend now puts the swing bias in line with the weekly trend. The breach of both the downward sloping trend line and significant 100 level now puts in play potential moves to both 100.60 and 101.50 swing levels.
2. Alternatively failure to sustain a move above the downward sloping trend line and significant 100 level added to the downside pressure offered by the Fibonacci area could lead to USDJPY trading back deep into the prior triangle pattern.
Daily Technical Analysis from ACFX 11/21/2013
Daily Technical Analysis for EURUSD as at 21st November 2013
Yesterday’s summary
During yesterday’s session EURUSD initially traded higher. This move resulted in EURUSD printing a 1 hour swing pivot high with a range of some 45 pips. During the London morning session EURUSD tested and traded around the bottom of this range prior to breaking aggressively down in the New York session. EURUSD eventually found support late in the New York session slightly above the 1.3400 level.
Market open focus
Overnight EURUSD has traded within a 30 pip range above the 1.3400 level. The key morning levels to watch are 1.3410 and 1.3450.
The possible projected maximum daily ranges based upon current price action are 1.3350 to 1.3510.
Today’s scenarios
1. EURUSD is trading within a 30 pip early morning range. I am monitoring potential shorts below 1.3410 with a target of 1.3350. However the 1.3400 may offer additional support.
2. Alternatively a potential break above 1.3450 has an upside intraday target of 1.3510.
Macro trade Ideas
1. The breach of the 16th October prior isolated low has changed the daily trend on a swing basis from up to down. The move back up to the averages and previously broken trend line yesterday proved a good value area where shorts could be added. I am monitoring a continuation of the move down to the 7th November low at 1.3300 levels a prior daily swing low.
2. However the weekly time frame continues to be swing positive. Therefore there is a possibility that the down trend on the daily chart is nothing more than a corrective sell off that brings the price action into potential value areas where long term swing position buy trades could be executed. It should also be noted that EURUSD has traded into a large Fibonacci support area where price action stalled and bounced. With this in mind there is potential for a substantial upside move that could bring the daily trend back into line with the weekly trend. This scenario is valid as long as EURUSD can trade above the 1st September swing long which comes in around the 1.3100 area.
The Macro Technical Targets
The upside targets are 1.3470, 1.3530, 1.3650, and 1.3830. The downside targets are 1.3300, 1.3200, 1.3100 and 1.2750.
Daily Technical Analysis for GBPUSD as at 21st November 2013
Yesterday’s summary
Yesterday GBPUSD trade higher in the European / London session. This was in contrast to the 30 pip range consolidation during the Tokyo session. This positivity continued into the New York session before abruptly reversing off the highs and collapsing by some 90 pips.
Market open focus
The overnight price action has seen GBPUSD trade lower during the Tokyo session only for support to come into the market at the 1.6070 level which also corresponds to trend line and slightly above the 19th November low.
Key early morning levels to watch are 1.6070 and 1.6100.
The possible projected maximum daily ranges based upon current price action are 1.6010 to 1.6170.
Today’s scenarios
1. GBPUSD is trading within a 30 pip early morning range. I am monitoring potential shorts below 1.6070 with a target of 1.6010.
2. Alternatively a potential break above 1.6100 has an upside intraday target of 1.6170.
Macro trade ideas
1. Following the breach of the 16th October swing low the trend on a daily swing basis has changed from up to down. This move was preceded by multiple trend line breaks and the averages switching their bias from up to down. With the price action having also broken through Fibonacci support the down side is now very much in focus on the daily time frame. Conservative entry methods as a means to participate in the down move could be to wait for possible pullbacks to key value areas such as the 8 period moving averages and trend line resistance.
2. Alternatively as the weekly time frame continues to have a positive swing bias and with the price action on the daily time frame very much extended from the averages there is a possibility of a substantial upside correction.
Marco Technical Targets
1.6260, 1.6170, 1.5890, 1.5715, 1.5570, 1.5720
Daily Technical Analysis for USDCHF as at 21st November 2013

Yesterday’s summary
USDCHF yesterday traded initially lower during the Tokyo session. The move down was halted the 0.9078 level which corresponds with the 34 period moving averages. USDCHF consolidated off its lows in both the Tokyo and London sessions. This consolidation did not last long as USDCHF as the price action broke aggressively higher during the New York session. The upside breakout printed a high at 0.9192.
Market open focus
The high print at 0.9192 has once been followed by a consolidation at the highs and a 33 range. The key morning levels to watch are 0.9159 and 0.9192.
The possible projected maximum daily ranges based upon current price action are 0.9120 to 0.9230.
Today’s scenarios
1. USDCHF is trading within a 33 pip early morning range. I am monitoring potential shorts below 0.9159 with a target of 0.9120.
2. Alternatively a potential break above 0.9192 has an upside intraday target of 0.9230.
Macro trade ideas
1. On a basis swing bases the trend is now positive following the breach of the prior isolated high. The price action has broken higher since trading within positively layered moving averages and above trend line support after what has been a substantial downside correction. An upside break would have initial target of the 9th September swing high at 0.9455.
2. However the weekly time frame continues to point down. Therefore a sustained breach of the 8 period moving averages puts into play a potential move to the 34 period moving averages
Macro technical levels
The macro technical levels are 0.9020 0.8930, 0.8570 and 0.9200.
Daily Technical Analysis for USDJPY as at 21st November 2013
Yesterday’s summary
Yesterday USDJPY traded within the range of the previous day’s session’s in what was a 45 pip range. A swing pivot London session 1 hour low was printed at 99.77.
Market open focus
USDJPY broke higher off the previous day’s low early in the Tokyo session. This moved continued throughout the morning. This has resulted in USDJPY printing a high early in the London session. This move has taken out the 11th September 100.60 high.
The key morning levels to watch are 100.65 and 100.85.
The possible projected maximum daily ranges based upon current price action are 100.10 to 101.35.
Today’s scenarios
1. USDJPY is trading within a 20 pip early morning range. I am monitoring potential shorts below 100.65 with a target of 100.10.
2. Alternatively a potential break above 100.85 has an upside intraday target of 101.35.
Macro trade ideas
1. With USDJPY having breached the prior swing high of the 17th October has changed the trend on a swing bias to up. The change of the daily trend now puts the swing bias in line with the weekly trend. The breach of both the downward sloping trend line and significant 100 levels now puts in play potential moves 101.50 swing levels. The previous 100.60 target having been reached this morning.
2. Alternatively failure to sustain a move above the 100.60 level could possibly see USDJPY trade back to the prior broken converging triangle.
Daily Technical Analysis from ACFX 11/22/2013
Daily Technical Analysis for EURUSD as at 22nd November 2013
Yesterday’s summary
Yesterday initially EURUSD traded lower and marginally breached the 1.3400 level. This down move turned out to be the full extent of yesterday’s negativity as EURUSD reversed and broke higher from this level during the London session.
During the New York session EURUSD continued to trade higher and eventually close near the top of its daily range.
Market open focus
EURUSD has been trading within a 40 odd pip overnight and Tokyo session range being 1.3444 to 1.3486. Currently EURUSD is currently attempting to breach the top of this range.
The key intraday levels to watch are 1.3399, 1.3433, 1.3444, 1.3486, 1.3532, and 1.3578.
The possible projected maximum daily ranges based upon current price action are 1.3399 to 1.3510.
Today’s scenarios
1. EURUSD is trading within a 40 pip early morning range. I am monitoring potential shorts below 1.3444 with a target of 1.3399. However the 1.3433 may offer additional support.
2. Alternatively a potential break above 1.3486 has an upside intraday target of 1.3510.
Macro trade Ideas
1. The breach of the 16th October prior isolated low has changed the daily trend on a swing basis from up to down. The move back up to the averages and previously broken trend line has proved a good value area where shorts could be added. I am monitoring a continuation of the move down to the 7th November low at 1.3300 levels a prior daily swing low.
2. However the weekly time frame continues to be swing positive. Therefore there is a possibility that the down trend on the daily chart is nothing more than a corrective sell off that brings the price action into potential value areas where long term swing position buy trades could be executed. It should also be noted that EURUSD has traded into a large Fibonacci support area where price action stalled and bounced. With this in mind there is potential for a substantial upside move that could bring the daily trend back into line with the weekly trend. This scenario is valid as long as EURUSD can trade above the 1st September swing long which comes in around the 1.3100 area.
The Macro Technical Targets
The upside targets are 1.3470, 1.3530, 1.3650, and 1.3830. The downside targets are 1.3300, 1.3200, 1.3100 and 1.2750.
Daily Technical Analysis for GBPUSD as at 22nd November 2013
Yesterday’s summary
GBPUSD traded lower during the Tokyo session before it found support and reversed at the 1.6070 level. Off this low GBPUSD broke higher during the European / London session. The move higher continued into the New York session with the GBPUSD eventually closing at its highs and printing a large 130 pip daily range.
Market open focus
This morning’s Tokyo session range of 1.6174 and 1.6202 being some 27 pips is relatively small compared to the prior sessions. GBPUSD has already made one attempt this morning to trade above the high of this range.
The key intraday levels to watch are 1.6070, 1.6108, 1.6174, and 1.6202.
The possible projected maximum daily ranges based upon current price action are 1.6100 to 1.6275.
Today’s scenarios
1. GBPUSD is trading within a 27 pip early morning range. I am monitoring potential shorts below 1.6174 with a target of 1.6100.
2. Alternatively a potential break above 1.6202 has an upside intraday target of 1.6275.
Macro trade ideas
1. The breach of the 16th October swing low the trend on a daily swing basis has changed from up to down. However the breach of the 6th November minor swing high and the averages crossing positively does put a question mark with respect to the strength of this trend. Despite this and with GBPUSD now trading up to multi month trend line resistance may offer a potential opportunity for the price action to once again reverse to the down side.
2. Alternatively the weekly time frame continues to have a positive swing bias which could indicate that the daily chart negativity could be little more than a downside correction. A break above the 23rd October high would confirm this scenario.
Marco Technical Targets
1.6260, 1.6170, 1.5890, 1.5715, 1.5570, 1.5720
Daily Technical Analysis for USDCHF as at 22nd November 2013

Yesterday’s summary
USDCHF yesterday traded higher during Tokyo session prior to breaking lower at the London open. The New York session saw USDCHF consolidate within a tight 25 pip range prior to resuming the downward momentum in overnight trading.
Market open focus
This morning’s Tokyo has seen USDCHF trade with a tight 23 pip range. I am currently monitoring a breach of 0.9126 being the bottom of the range during the London session.
The key intraday levels to watch are 0.9078, 0.9112, 0.9159, and 0.9192.
The possible projected maximum daily ranges based upon current price action are 0.9078 to 0.9192.
Today’s scenarios
1. USDCHF is trading within a 23 pip early morning range. I am monitoring potential shorts below 0.9126 with a target of 0.9078.
2. Alternatively a potential break above 0.9150 has an upside intraday target of 0.9192.
Macro trade ideas
1. On a basis swing bases the trend is now positive following the breach of the prior isolated high. The price action has broken higher since trading within positively layered moving averages and above trend line support after what has been a substantial downside correction. An upside break would have initial target of the 9th September swing high at 0.9455.
2. However the weekly time frame continues to point down. Therefore a sustained breach of the 8 period moving averages puts into play a potential move to the 34 period moving averages
Macro technical levels
The macro technical levels are 0.9020 0.8930, 0.8570 and 0.9200.
Daily Technical Analysis for USDJPY as at 22nd November 2013
Yesterday’s summary
Yesterday USDJPY traded higher during the Tokyo session and this positivity continued in the London and New York sessions in what was a very large 115 pip daily range.
Market open focus
During this morning’s Tokyo session USDJPY has traded within a 35 pip range. I am currently monitoring an initial attempt break beneath 100.98 being the bottom of this range.
The key morning levels to watch are 99.59, 99.99, 100.98, and 101.35.
The possible projected maximum daily ranges based upon current price action are 100.60 to 101.70.
Today’s scenarios
1. USDJPY is trading within a 35 pip early morning range. I am monitoring potential shorts below 100.98 with a target of 100.60.
2. Alternatively a potential break above 101.35 has an upside intraday target of 101.70.
Macro trade ideas
1. With USDJPY having breached the prior swing high of the 17th October has changed the trend on a swing bias to up. The change of the daily trend now puts the swing bias in line with the weekly trend. The breach of both the downward sloping trend line and significant 100 levels now puts in play potential moves 101.50 swing levels. The previous 100.60 target having been reached.
2. Alternatively failure to sustain a move above the 100.60 level could possibly see USDJPY trade back to the prior broken converging triangle.
Daily Technical Analysis from ACFX 11/25/2013
Daily Technical Analysis for EURUSD as at 25th November 2013

Yesterday’s summary
Friday initially EURUSD traded lower during the Tokyo session. However this negativity was short lived as EURUSD reversed off its lows and broke higher into the London session. This move continued into the New York session and saw EURUSD close on a daily and weekly basis near to its highs.
Market open focus
This morning’s Toyo session has seen EURUSD correct some 25 pip lower from the session highs. We are monitoring the price action for signs of as continuation of this down move into the London session.
The key intraday levels to watch are 1.3398, 1.3442, 1.3460, 1.3475, 1.3536 and 1.3560.
The possible projected maximum daily ranges based upon current price action are 1.3460 to 1.3630.
Today’s scenarios
1. EURUSD is trading within a 25 pip early morning range. I am monitoring potential shorts below 1.3536 with a target of 1.3460.
2. Alternatively a potential break above 1.3560 has an upside intraday target of 1.3630.
Macro trade Ideas
1. The breach of the 16th October prior isolated low has changed the daily trend on a swing basis from up to down. The move back up to the averages and previously broken trend line has proved a good value area where shorts could be added. I am monitoring a continuation of the move down to the 7th November low at 1.3300 levels a prior daily swing low.
2. Alternatively the weekly time frame continues to be swing positive. Therefore there is a possibility that the down trend on the daily chart is nothing more than a corrective sell off that brings the price action into potential value areas where long term swing position buy trades could be executed. It should also be noted that EURUSD has traded into a large Fibonacci support area where price action stalled and bounced. With this in mind there is potential for a substantial upside move that could bring the daily trend back into line with the weekly trend. This scenario is valid as long as EURUSD can trade above the 1st September swing long which comes in around the 1.3100 area.
The Macro Technical Targets
The upside targets are 1.3470, 1.3530, 1.3650, and 1.3830. The downside targets are 1.3300, 1.3200, 1.3100 and 1.2750.
Daily Technical Analysis for GBPUSD as at 25th November 2013

Yesterday’s summary
Friday GBPUSD traded in a tight range during Tokyo trading before trading marginally higher during the London and New York sessions.
Market open focus
This morning has seen GBPUSD correct some 33 points lower off its opening Tokyo session morning high. I am monitoring the 1.6202 level as a possible area of support or if broken an indication that the downside correction will be extended into the London session.
The key intraday levels to watch are 1.6071, 1.6107, 1.6175, 1.6202 and1.6240.
The possible projected maximum daily ranges based upon current price action are 1.6140 to 1.6300.
Today’s scenarios
1. GBPUSD is trading within a 30 pip early morning range. I am monitoring potential shorts below 1.6202 with a target of 1.6140.
2. Alternatively a potential break above 1.6240 has an upside intraday target of 1.6300.
Macro trade ideas
1. The breach of the 16th October swing low has changed the trend on a daily swing basis from up to down. However both the breach of the 6th November minor swing high and the averages crossing positively does put a question mark on the strength of this trend. Despite this and with GBPUSD now trading up to multi month trend line resistance may offer a potential opportunity for the price action to once again reverse to the down side.
2. Alternatively the weekly time frame continues to have a positive swing bias which could indicate that the daily chart negativity could be little more than a downside correction. A break above the 23rd October high would confirm this scenario.
Marco Technical Targets
1.6260, 1.6170, 1.5890, 1.5715, 1.5570, 1.5720
Daily Technical Analysis for USDCHF as at 25th November 2013
Yesterday’s summary
Friday USDCHF initial traded lower during Tokyo session prior to breaking down. This down move continued and accelerated during the London and New York sessions.
Market open focus
USDCHF has bounced off the downward sloping trend line during this morning’s Tokyo session. I am monitoring the possibility for this bounce to continue during London trading
The key intraday levels to watch are 0.9060, 0.9089, 0.9150, 0.9159 and 0.9192.
The possible projected maximum daily ranges based upon current price action are 0.9020 to 0.9130.
Today’s scenarios
1. USDCHF is trading within a 30 pip early morning range. I am monitoring potential longs above 0.9089 with a target of 0.9130.
2. Alternatively a potential break below 0.9060 has a downside intraday target of 0.9020.
Macro trade ideas
1. On a basis swing bases the trend is now positive following the breach of the prior isolated high. However the price action has been struggling to extend a move away from the downside sloping trend line. Notwithstanding this as long USDCHF can trade above 0.8889 being the current isolated low then the potential for a substantial upside breakout is possibility.
2. However the weekly time frame continues to point down. Therefore a sustained breach of the 34 period moving averages puts into play a move to the 0.8889 isolated low areas.
Macro technical levels
The macro technical levels are 0.9020 0.8930, 0.8570 and 0.9200.
Daily Technical Analysis for USDJPY as at 25th November 2013
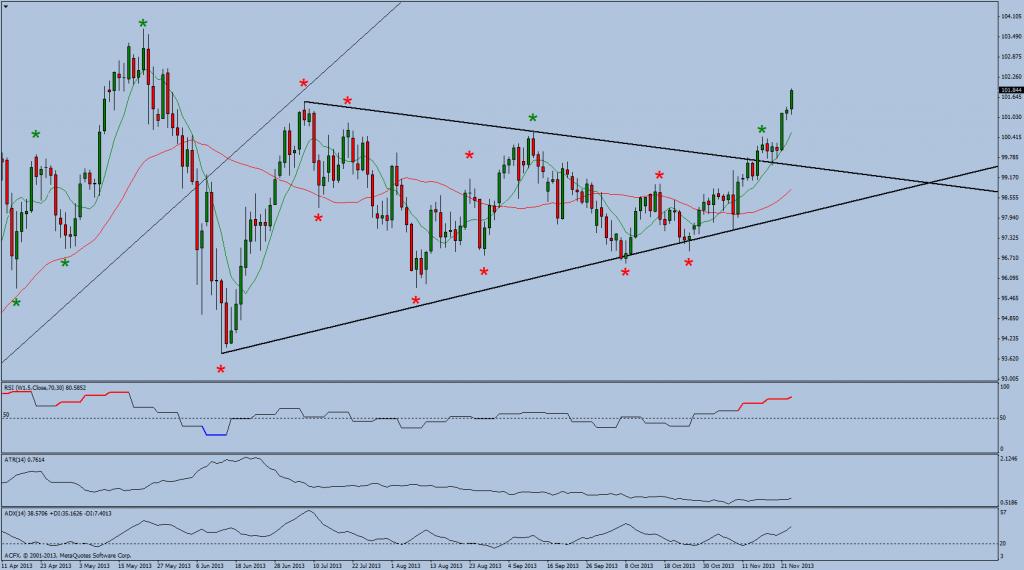
Yesterday’s summary
Friday USDJPY traded within a range of some 40 pips throughout the Tokyo, London and New York session.
Market open focus
In comparison to Friday’s small range USDJPY has broken higher and already traded an 80 pip range during this morning’s Tokyo session. This morning’s move has in the process taken out the 101.52 level being a prior swing high. I am monitoring the possibility that this positive market action continues into the London session.
The key intraday levels to watch are 99.54, 100.26, 100.95, 101.60, and 101.93.
The possible projected maximum daily ranges based upon current price action are 101.15 to 101.92.
Today’s scenarios
1. USDJPY has traded an 80 pip early morning break out. I am monitoring potential longs above 101.93. However as this morning’s move already equates to one daily average range further upside maybe limited.
2. Alternatively a potential break beneath 101.60 has a downside intraday target of 101.15.
Macro trade ideas
1. With USDJPY having breached the prior swing high of the 17th October has changed the trend on a swing bias to up. The change of the daily trend now puts the swing bias in line with the weekly trend. The breach of both the downward sloping trend line and significant 100 levels now puts in play potential moves 103.73 swing level which is also a major multi year high. The previous 101.52 target having been breached this morning.
2. Alternatively failure to sustain a move above the 101.52 level could possibly see USDJPY trade back to the prior broken converging triangle.
- Free trading apps
- Over 8,000 signals for copying
- Economic news for exploring financial markets
You agree to website policy and terms of use
Daily Technical Analysis from ACFX 11/11/2013
Daily Technical Analysis for EURUSD as at 11th November 2013
DAILY OVERVIEW
Trend : Down
Ambush Zone : -
Target 1 : -
Target 2 : -
Stop : -
Comments
Friday was another wide range day which eventually closed lower. Although Friday’s price action managed to close beneath Thursday’s close there was not sufficient downside momentum for EURUSD to trade beneath the low of Thursday’s trading range. This morning’s open has thus far been quiet and within Fridays trading range.
This morning EURUSD has opened negatively. We are monitoring the price action for indications for continuation of the down trend that will allow for a move beneath 7th November low or a further correction off the V bottom that takes the price action to prior trend line support.
In terms of the bigger picture following the breach of the 16th October prior isolated low has changed the daily trend on a swing basis from up to down. This negative swing bias has been confirmed by multiple breaches of trend line support and the moving averages being layered negatively. Furthermore the RSI positive divergence has been invalidated by the 7th November break down.
However the move down did find support and with EURUSD now extended from its averages there is a possibility of further upside correction.
The Macro Technical Targets
The upside targets are 1.3470, 1.3530, 1.3650, and 1.3830. The downside targets are 1.3300, 1.3200, 1.3100 and 1.2750.
Scenario 1
As the dominant daily trend is down retracements into resistance could be viewed as selling opportunities.
Scenario 2
Alternatively as EURUSD is extended from the averages there is a potential for further upside correction.
Daily Technical Analysis for GBPUSD as at 11th November 2013
DAILY OVERVIEW
Trend : Long
Ambush Zone : -
Target 1 : -
Target 2 : -
Stop : -
Comments
On Friday GBPUSD retested trend line support but failed in its attempt to breach this area. This morning’s open has so far been quiet with the price action trading just above the trend line and with Fibonacci support.
On a daily swing bases GBPUSD continues to trend positively on both daily and weekly time frames. However the current price action would appear to be attempting to print a lower high. Therefore it is important for the health of the current uptrend that GBPUSD does note trade beneath the 16th October isolated low. That the RSI is diverging positively does give the long side some encouragement but it should be noted that the averages have crossed negatively for the first time since July 2013.
Marco Technical Targets
1.6260, 1.6170, 1.5890, 1.5715, 1.5570, 1.5720
Scenario 1
As the dominant daily trend is up retracements into support could be viewed as buying opportunities.
Scenario 2
Alternatively as GBPUSD is trading around the 8/34 SMA resistance area there is a possibility that the price action rejects this level and trades back down to 1.5890 being a prior isolated low that was printed on 16th October.
Daily Technical Analysis for USDCHF as at 11th November 2013
DAILY OVERVIEW
Trend : Up
Ambush Zone : -
Target 1 : -
Target 2 : -
Stop : -
Comments
Friday USDCHF made a further attempt to breach trend line resistance but was unable break above this area. However the price action did manage to close near the highs of its days range.
This morning’s open has thus far been quiet. We are monitoring the price action for signs that USDCHF will either make another attempt to retest trend line resistance or fall back to its overextended averages.
On a basis swing bases the trend is now positive following the breach of the prior isolated high. The moving averages are now layered positively and the breach of trend line resistance and the invalidation of Fibonacci resistance and the negative RSI divergence give further confirmation to the upside.
However the weekly time frame continues to point down and the price action is now extended from the averages which could lead a downside correction.
Intraday levels to watch are 0.9250 and 0.9105.
Macro technical levels are 0.9020 0.8930, 0.8570 and 0.9200.
Scenario 1
As the dominant daily trend is up corrective pullbacks could possibly offer buying opportunities with retracements back to the averages, the prior pivot low and broken support being value areas where longs could potentially be added.
Scenario 2
Alternatively as the price action is extended there is potential for shorting opportunities back to the averages.
Daily Technical Analysis for USDJPY as at 11th November 2013
DAILY OVERVIEW
Trend : Up
Ambush Zone : -
Target 1 : -
Target 2 : -
Stop : -
Comments
Following Thursday 7th volatile day which printed both a higher high and lower close attention was focused on which way USDJPY would move and if the price action that followed confirmed the direction. Friday’s price action has given some confirmation that the printing of the higher high will lead to a new uptrend. Friday’s bar did in fact close strongly and near the top of its trading range and above positively layered averages. However Friday’s bar did not breach the 7th November high. We would want to see such a breach for further upside confirmation.
This morning USDJPY has opened slightly negatively but it is rather early in the session to extract any conclusions from this. Our main focuses of attention for today is can USDJPY trade above the 7th November high and then make an attempt in breaching the downward sloping trend line.
As mentioned in previous postings the potential increase in volatility was foreseen by the recent contraction of daily ranges. With USDJPY now breaching the prior swing high of the 17th October has changed the trend on a swing bias to up. The change of the daily trend now puts the swing bias in line with the weekly trend. An indication of a potential trend change was given by the higher low printed on the 25th October. If we now see an expansion of the daily ranges there is a possibility of a potential break of the downward sloping trend line that forms the upper limit of a large converging triangle.
However the overhead Fibonacci area that has offered good resistance will have to be overcome to allow for further upside with a failure to trade higher could see USDJPY trade back to trend line support.
Scenario 1
As the dominant daily trend is up retracements into support could be viewed as buying opportunities.
Scenario 2
Alternatively both the Fibonacci resistance and upper trend line of the converging triangle could offer downside pressure that pushes USDJPY back to support.