Building a VSA Trade Setups Auto Scanner/Alert/Analysis
Here is a simple example that you can provide. Correct me if my analysis is wrong.
The screenshot is from the C# application that I'm developing.
The chart is for AA, stock daily chart, data from Yahoo Finance. In the picture below, there are two VSA setups
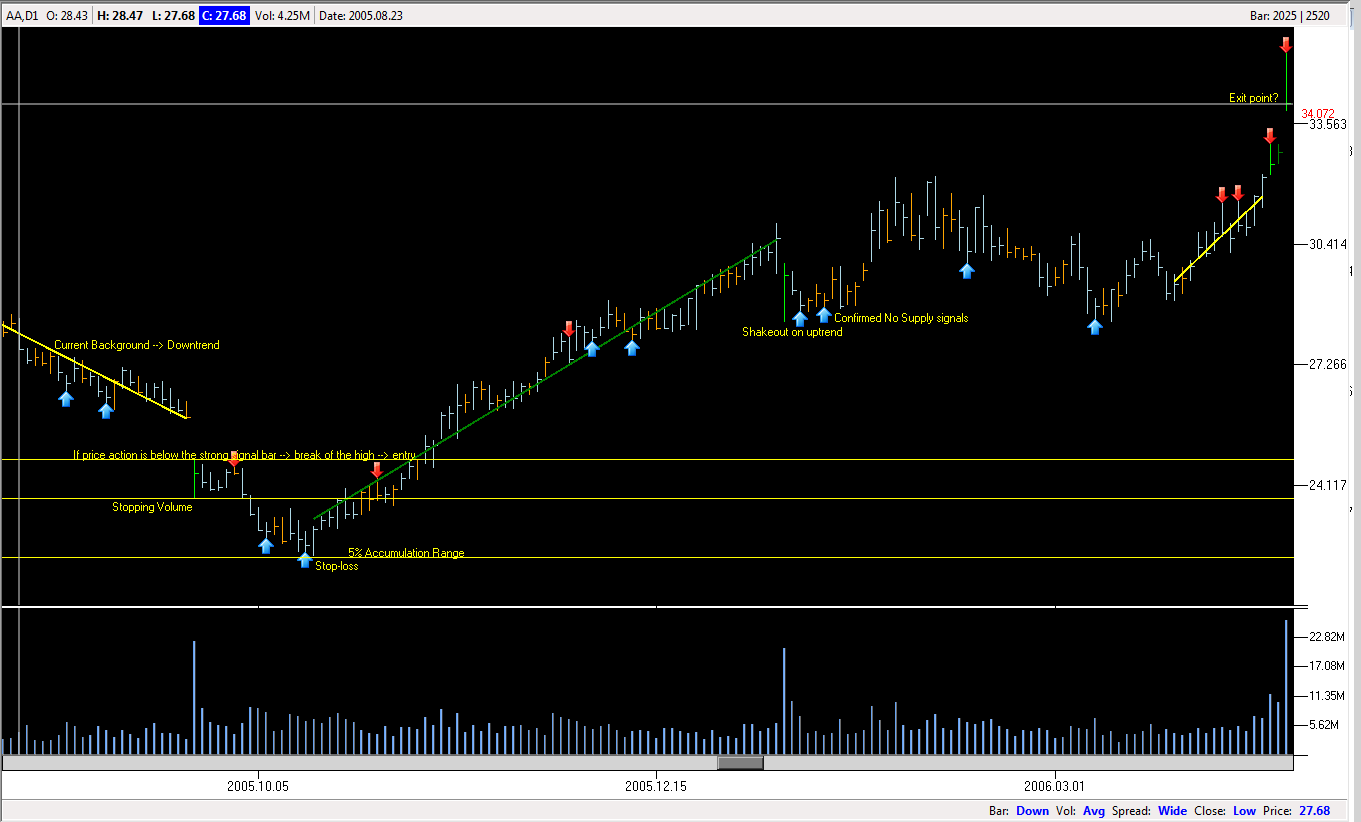
I need complete explanation of entry/exit rules for each setup. For instance, right here I have a downtrend in the background (on the left) where I have a yellow linear regression line drawn. A stopping volume marked by an ultra high volume bar that closes off high (upper middle), and the price action failed to follow through a few bars after that (3 to 5 bars - no new lows).
In this setup, the price action is building its accumulation phase (?) below the low of the ultra high volume bar (or strong signal bar - Stopping Volume in this case). All of this happens within the range of 5% below the low of the strong signal bar.
There are two good Tests/No Supply because next bars are up bars, and within the range of 5%. The range of 5% is good (?) for not considering the ultra high volume bar above as resistance level.
Since price action happened below the low of the strong signal bar, in this setup, I will use trailing entry when price break the high of the ultra high volume bar (Stopping Volume bar)...
Within the code, I will analyse the chart and capture the number of confirmations of minor signals (Tests/No Supply) and send out the alert when price action approach the high of the ultra high volume bar (in this setup)...That's the idea of the application.
Moreover, when the application can recognize the setup correctly, I can dostatistical analysis that combine with Bayesian network to carry out decision making feature.
---
The second VSA setup in this chart is Shakeout in an uptrend. The green line is drawn by linear regression, and there is a good Shakeout (green bar as ultra high volume) on ultra high volume, and price action failed to follow through few bars (3-5 bars) after that.
There are two confirmed No Supply after that, and another No Supply to the right of the chart within the range of 5% of the Shakeout bar...Price claimed up after that (but right here, the application won't wait until the price claims up to send out alert, ... in this case, it might has a false alarm when price break the high of the Shakeout bar - or I might put more filter right here)
Hope it make sense.
I think sharing the app your trying to develop would help to accelerate the process...
Are you still working on this/looking for help? If so email me at chris.r.floyd@gmail
- Free trading apps
- Over 8,000 signals for copying
- Economic news for exploring financial markets
You agree to website policy and terms of use
Hello all,
I mentioned this idea in babybips.com, but it could not draw enough attention to their members, so I decided to give forex-tsd a shot.
After almost a year studying about trading, risk, and money management, I came up with the idea of recognizing VSA setups and sending out alerts automatically. There are some ideas behinds that, but for the initial achievement, I'd like to code an expert adviser or independent application that cantrigger alerts when there are some good/potential VSA setups.
I have been coding in C# to recognize VSA setups automatically. There are reasons that I want to code in C# are the flexibility of using the signals on any markets - stock, forex, etc...From C#, I can integrate with Metatrader easily using TradingPlatform framework or by using file transferring between the platforms with no problems. Programming and coding is not a big problem for my at the moment. Moreover, I am thinking of integrating neural networks and Bayesian to the application after it has some reasonable outcome (statistical data).
Right now, due to my limited knowledge about VSA setup(s), I need the inputs from you to help me to build a complete application that can recognize good/potential VSA setups.
What the application looks like right now- The current C# application can pull data from Yahoo Finance and display VSA signals onto chart. It has some basic background trend analysis using Linear Regression with ZigZag indicator. The ZigZag indicator is recoded from standard Metatrader 4 ZigZag.
- I will code the app to support eSignal data feed later. Currelty, it supports only End of day data or from CSV file imports.
- It has some basic chart analysis such as adding Text, vertical line, horizontal line, ...
- It has some basic VSA signal filter for each individual signal.
- The current coding structure of the app is on each chart, it will find a VSA Setup that includes more than 1 VSA Signal. I classified VSA signals into classes based on its strength and weaknesses. Moreover, I checked individual VSA signal to see if it's confirmed or not, is it an ideal signal on its own term...A complete VSA Setup will have strong signals in the background, background trends (current and major trend), and all are confirmed by minor VSA signals.
- Attached below are the screenshot of the current application.
What are the foundations of my methodology- My method bases on statistical analysis of the historical data and verified by out of sample data. In addition, I might build a Monte Carlo simulation for the app later (super far future!). I believe a system that has better performance based on statistical analysis will perform better.
- I build reasoning and decision making feature by inferring Bayesian network that was built from historical data.
What you will get:- Based on the inputs/contributions, each of the contributor will have a copy of the completed (to be fair, it will be password protected) application. Right now, I can think of an application that send out alerts for almost good/potential VSA setups (and some auto analysis such as Trend line, Channel Line with Upthrust, Stop-loss suggestion, etc in later versions)
What you can do:- Provide complete VSA trade setups with your explanations for entry/exit/stop-loss rules. The VSA setups are not limited to FOREX only, but I'd like to see inputs in stock and future markets as well.
- If you can suggest "how-to" analyze the VSA setups, I can convert it to code. If VSA is a trading rules, it must have consistent rules at certain level. If it has rules, I can code it.
In the future, as we move on, the application can learn from the real experience since I already implemented Bayesian and Support Vector Machine functions. When the application can recognize the VSA setups (as you input to this thread), we can have some good historical statistical data. From these data, the neural network and Bayesian functions of the application can improve itself time after time. In other words, the application can learn from the real-time experience after each trade setup. Since I build the application on C# language, there are no limits for any sharp inputs from you.
All of the above statements are my personal judgement, feel free to correct me. All suggestions are welcome.