Tdi ea
I came along the TDI trading method a couple of months ago. There is a manual trading system out there developed by Dean Malone and I think there is also a Synergy thread somewhere in this forum. To be honest I am not a big fan of his latest system because there is too much confirmation going on until you are allowed to enter the trade. And as far as I know Dean Malone mostly relies on his TDI system which was published first back in 2006/2007. Anyhow I did alot of backtesting and I am stll really convinced of the TDI, which is normally not the case. Many of you might have noticed this themselves: You see a new indicator that you did not come across before and you are super happy with it for the first days, after that you see the downside (and keep on searching for new ones).
There are several versions of the TDI out at the moment: The normal and smoothed one are posted in the attachments for those interested. The following pic shows these two TDI versions giving the buy sell signal in the Daily USD/CHF (which I radomly picked) 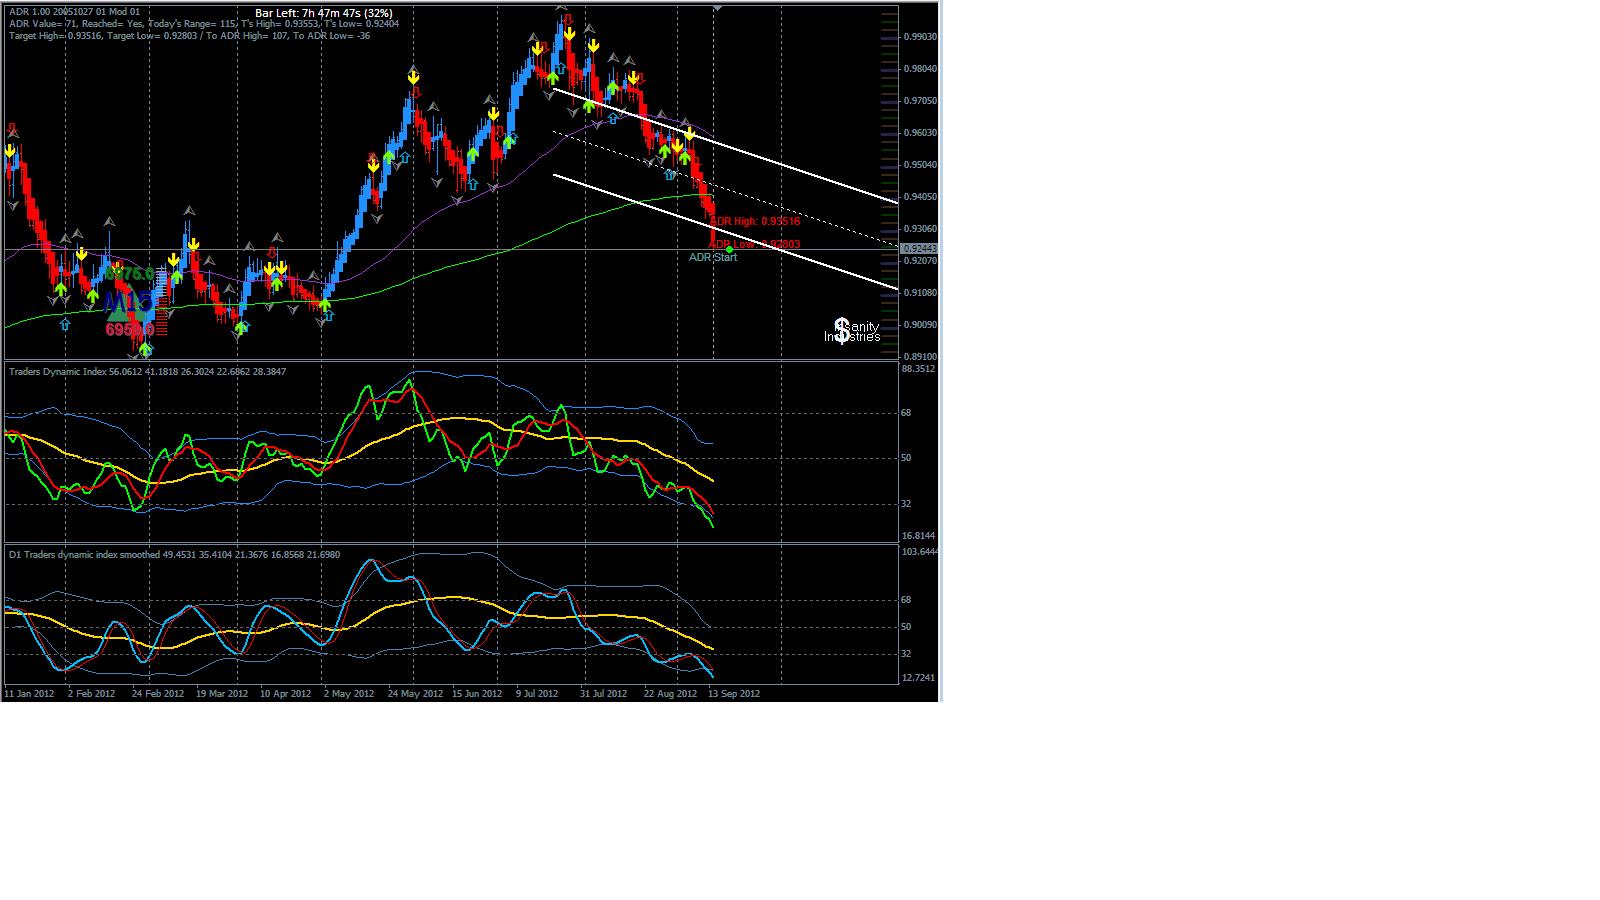 Decide for yourself which one is better. IMO over time they equalize themselves.
Another essential in trading the TDI are the timeframes. In the Daily, weekly or even monthly I would say a mid-longterm investor can trade the signals on their own without confirmation of another, larger timeframe. But what about the smaller ones, what about the trader who wants to make his daily 50 pips. My backtesting suggests that trading just from a 5 Min chart is sometimes a little bit dangerous. In these cases you want further confirmation of higher timeframes. It is said that 5Min-60 Min confirmation is something you can trade or 15 Min-240 Min. Here is an example of one day of DAX trading. By the way just trading the signal itself is not the way to go in the original sense. You want to make sure where the TDI Cross happens. I will talk about this in a minute.
You can see just trading 5Min signals gives you lots of trades and overall per day you will still archieve 10-50 Dax points AFTER spread (I pay 1 point spread, which is quiet competitve; you can also do this for any currency pair). Lets have a look at the same day, but now we have confirmation from the 60Min chart. That means the direction that the 60 Min chart gives us is the only one traded. Also important to mention: we use the sell signal on the 5Min chart to exit the trade again and wait for a new buy signal to enter the next one. What can we see: I counted both versions: Trading of the 5 Min chart only from 08:00 until 17:35 (Dax Close): 23 Trades, 119 + points overall that day; For every trade 1 point spread in my case, you do the math; I also have to admit: the big move made us about 70 pips only and counting just from the chart is not 100% accurate; even if we make it 100 points, still really good.
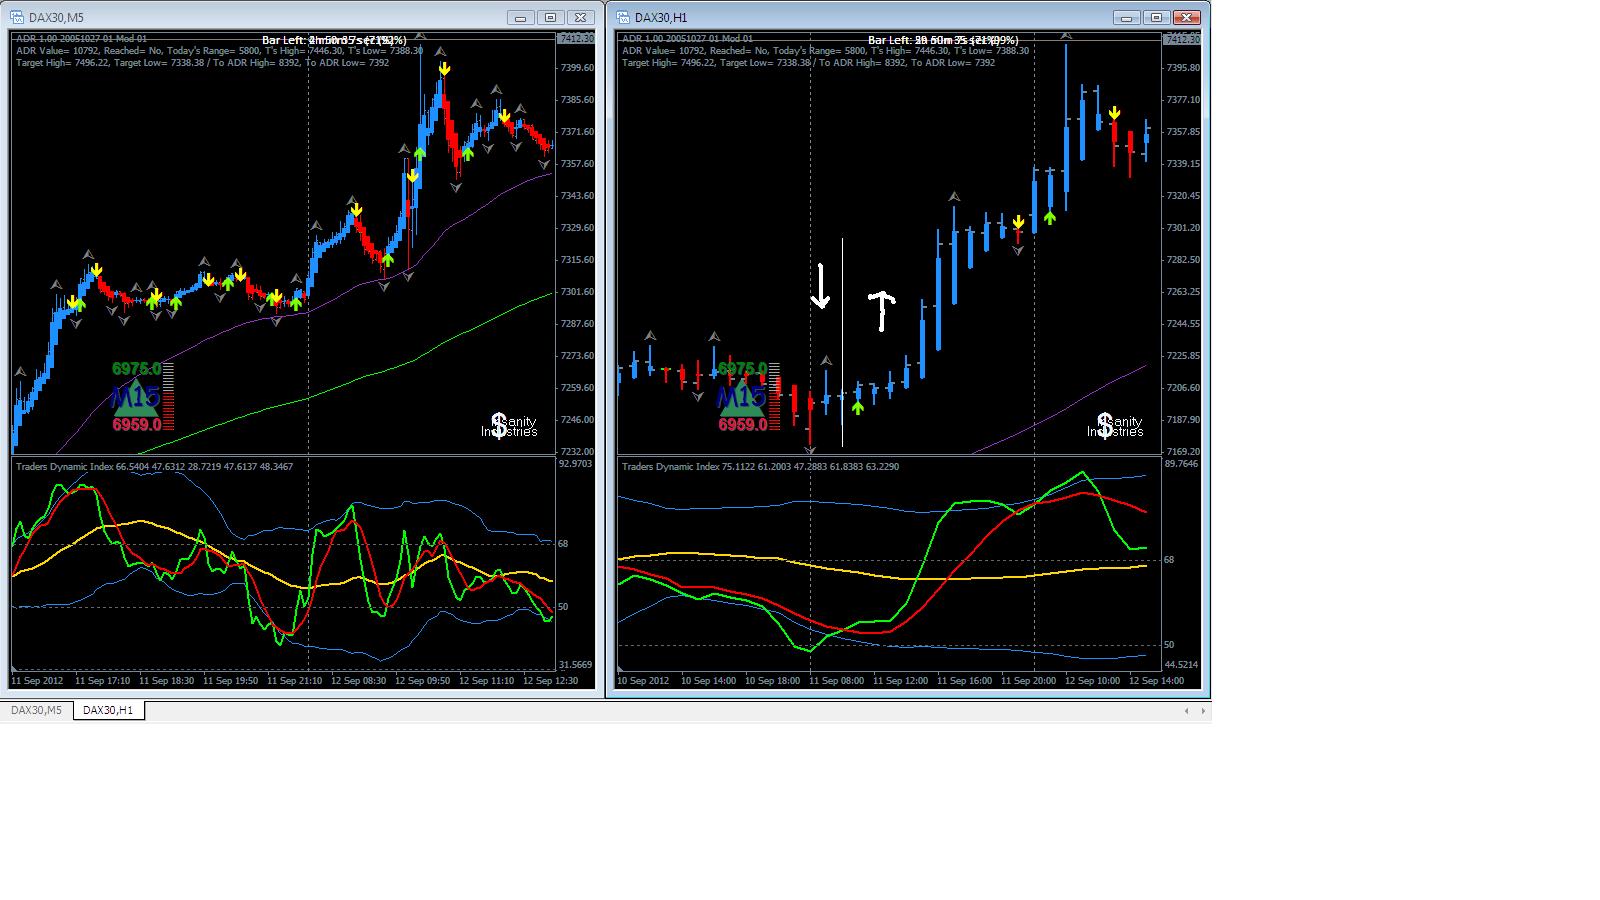
Ok lets look at the same day 9/11/2012 now the 60 Min chart comes into play as the larger timeframe: The 60Min tells us: From 8-10 we are down (from the previous day), we turn to up at 11, so from this point on only take Buy trades. I also calculated this from the chart: 14 Trades, overall 104 points, also really good.
So on this day, both trading styles were profitable. Another point we have to mention: We always pulled out when the countertrend signal came up, so we might have pulled earlier with more points before, when indicators signalled so, for example candles turned colour or.
Lets talk about the point of entry for a second: When the red line is above the yellow MBL and the green cross to the upside and we are between 50 and 68, thats normally a trend trade. When the green has been out of the VB and is even under 32/or above 68 thats a countertrend trade and you can be pretty sure that at least profit taking is taking place for a minute. For the larger timeframes that is very true, for the smaller ones harder to point out.
What about ranging markets? Yes this takes place even on smaller timeframes, so Dean Malone added a Volatility indicator to stay out of these trades. Not a bad thing to do. I am looking forward to ideas here how to avoid those kind of trades. Another idea of mine: Only trade between certain times. For the DAX this would mean: Only trade the opening from 8-11/12, stay out until 14 and trade the US opening until DAX closing auction at 17:35. But thats hard say. Even harder for currencies: But here we can say: Stay out of Asia session for sure and wait for London opening.
So overall my point is: Is it possible to create an EA out of this pretty simple method? I am looking forward to any ideas/thoughts on this.2_tdi.mq42tdi_rsx_based_-_smoothed_amp_alerts.ex4Hi Jonny473,
Welcome to the elite section and thanks for starting this interesting thread. To start in case you haven't seen we have quite a few different versions of TDI here https://www.mql5.com/en/forum/178673 and can make a version using just about any indicator, also there is kind of a spin off version using a sort of range adaptive bands. As far as making a Ea would say its possible.
Hi Jonny473, Welcome to the elite section and thanks for starting this interesting thread. To start in case you haven't seen we have quite a few different versions of TDI here https://www.mql5.com/en/forum/178673 and can make a version using just about any indicator, also there is kind of a spin off version using a sort of range adaptive bands. As far as making a Ea would say its possible.
Hi Mr Tools, checked out most of them, some TDI indicators dont work though. But I guess the normal, smoothed, rsx smoothed are the most important ones as far as I know. So you see my intension?
Hi Mr Tools, checked out most of them, some TDI indicators dont work though. But I guess the normal, smoothed, rsx smoothed are the most important ones as far as I know. So you see my intension?
Hi Jonny,
Not sure if this one has been posted before in TDI form its smoothed with jurik and you have a choice of 4 different rsi's, regular,wilders,rsx, or cutlers.
Good indicator! All the 4 options included in one file!
Good indicator! All the 4 options included in one file!
This is the TDI indicator with Ea you asked for in email, please just consider this a start to built on. Its coded to close on trend change(where trend is red green line cross), but not doing that on back testing, being i don't trust back testing for much anymore wondering if you could help me forward test to see how it goes.
This is the TDI indicator with Ea you asked for in email, please just consider this a start to built on. Its coded to close on trend change(where trend is red green line cross), but not doing that on back testing, being i don't trust back testing for much anymore wondering if you could help me forward test to see how it goes.
#include <stdlib.mqh>
#include <stderror.mqh>
#include <stdlib.mqh>
#include <stderror.mqh>
- Free trading apps
- Over 8,000 signals for copying
- Economic news for exploring financial markets
You agree to website policy and terms of use
I came along the TDI trading method a couple of months ago. There is a manual trading system out there developed by Dean Malone and I think there is also a Synergy thread somewhere in this forum. To be honest I am not a big fan of his latest system because there is too much confirmation going on until you are allowed to enter the trade. And as far as I know Dean Malone mostly relies on his TDI system which was published first back in 2006/2007. Anyhow I did alot of backtesting and I am stll really convinced of the TDI, which is normally not the case. Many of you might have noticed this themselves: You see a new indicator that you did not come across before and you are super happy with it for the first days, after that you see the downside (and keep on searching for new ones).
There are several versions of the TDI out at the moment: The normal and smoothed one are posted in the attachments for those interested. The following pic shows these two TDI versions giving the buy sell signal in the Daily USD/CHF (which I radomly picked) Decide for yourself which one is better. IMO over time they equalize themselves.
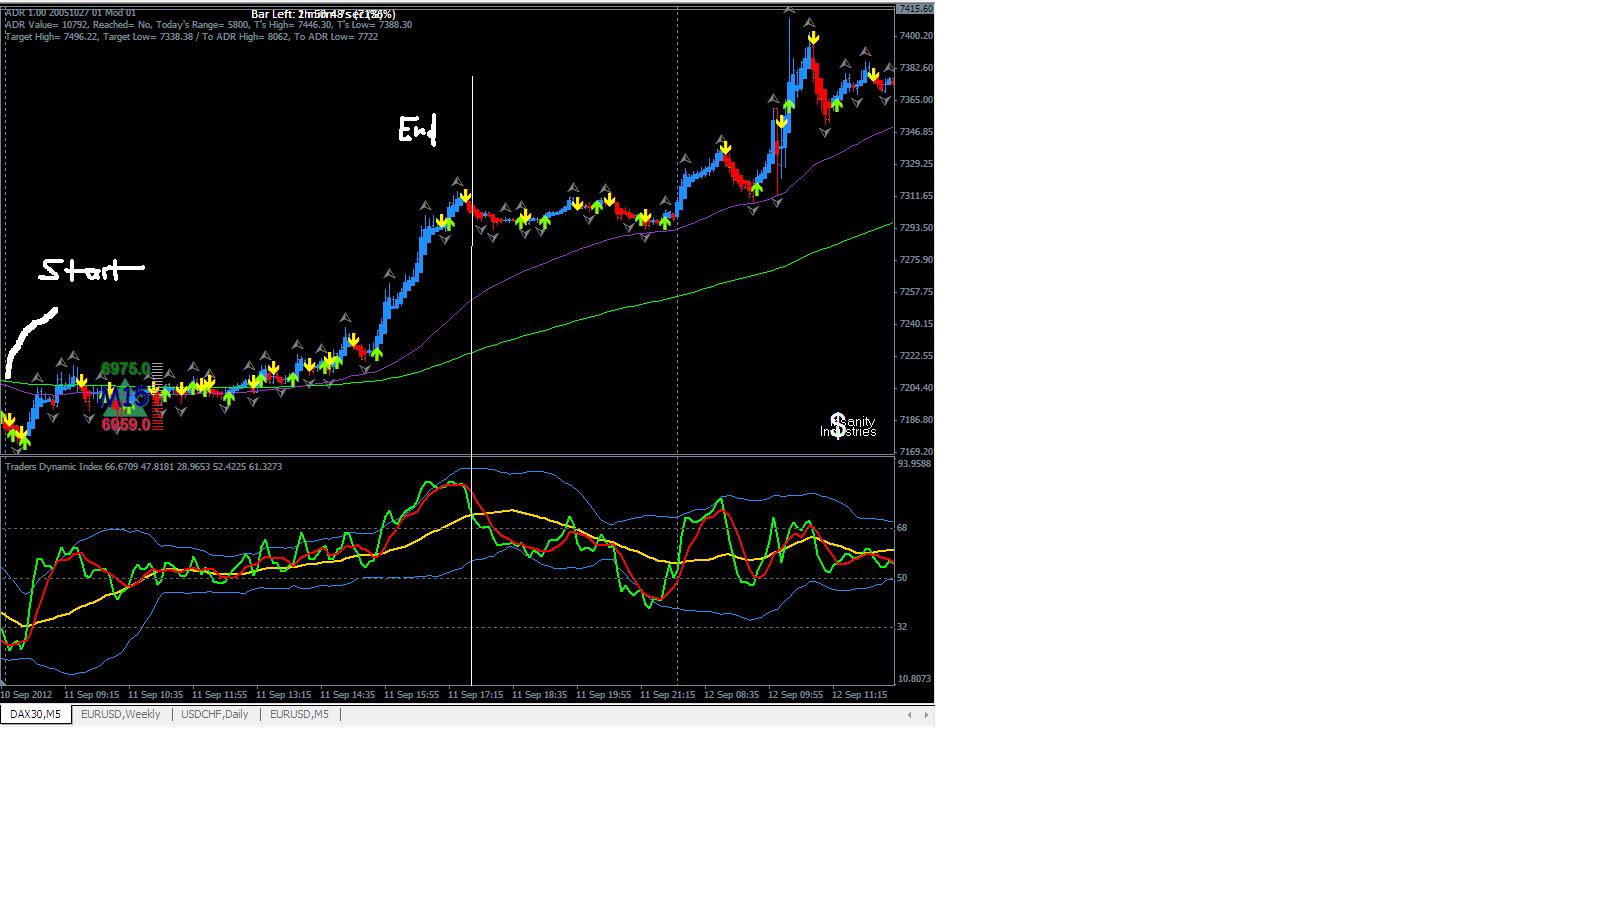
Another essential in trading the TDI are the timeframes. In the Daily, weekly or even monthly I would say a mid-longterm investor can trade the signals on their own without confirmation of another, larger timeframe. But what about the smaller ones, what about the trader who wants to make his daily 50 pips. My backtesting suggests that trading just from a 5 Min chart is sometimes a little bit dangerous. In these cases you want further confirmation of higher timeframes. It is said that 5Min-60 Min confirmation is something you can trade or 15 Min-240 Min. Here is an example of one day of DAX trading. By the way just trading the signal itself is not the way to go in the original sense. You want to make sure where the TDI Cross happens. I will talk about this in a minute.
You can see just trading 5Min signals gives you lots of trades and overall per day you will still archieve 10-50 Dax points AFTER spread (I pay 1 point spread, which is quiet competitve; you can also do this for any currency pair). Lets have a look at the same day, but now we have confirmation from the 60Min chart. That means the direction that the 60 Min chart gives us is the only one traded. Also important to mention: we use the sell signal on the 5Min chart to exit the trade again and wait for a new buy signal to enter the next one. What can we see: I counted both versions: Trading of the 5 Min chart only from 08:00 until 17:35 (Dax Close): 23 Trades, 119 + points overall that day; For every trade 1 point spread in my case, you do the math; I also have to admit: the big move made us about 70 pips only and counting just from the chart is not 100% accurate; even if we make it 100 points, still really good.
Ok lets look at the same day 9/11/2012 now the 60 Min chart comes into play as the larger timeframe: The 60Min tells us: From 8-10 we are down (from the previous day), we turn to up at 11, so from this point on only take Buy trades. I also calculated this from the chart: 14 Trades, overall 104 points, also really good.
So on this day, both trading styles were profitable. Another point we have to mention: We always pulled out when the countertrend signal came up, so we might have pulled earlier with more points before, when indicators signalled so, for example candles turned colour or.
Lets talk about the point of entry for a second: When the red line is above the yellow MBL and the green cross to the upside and we are between 50 and 68, thats normally a trend trade. When the green has been out of the VB and is even under 32/or above 68 thats a countertrend trade and you can be pretty sure that at least profit taking is taking place for a minute. For the larger timeframes that is very true, for the smaller ones harder to point out.
What about ranging markets? Yes this takes place even on smaller timeframes, so Dean Malone added a Volatility indicator to stay out of these trades. Not a bad thing to do. I am looking forward to ideas here how to avoid those kind of trades. Another idea of mine: Only trade between certain times. For the DAX this would mean: Only trade the opening from 8-11/12, stay out until 14 and trade the US opening until DAX closing auction at 17:35. But thats hard say. Even harder for currencies: But here we can say: Stay out of Asia session for sure and wait for London opening.
So overall my point is: Is it possible to create an EA out of this pretty simple method? I am looking forward to any ideas/thoughts on this.2_tdi.mq42tdi_rsx_based_-_smoothed_amp_alerts.ex4