MM Simulation
Igor,
There are people outside of your bubble that do have system that is profitable without any type of MM strategy. Most likely, it is very few. But I'm sure it does exist. There are too many ways to skin a cat. MM is not the only game in town.
Hi Michel,
I know that we are not on best of terms with eachother but still I like to make some contribution to your topic .
My system is a radom system. I would even like to trade it a random trade generator. I did that on purpose. The reason on purpose is tat I tryed for 13 years to seek a system that would have an edge that shows a more then 50% reliability and with a avg win that must be bigger then the avg. loss. Witch after 13 years I accpet now as beeing impossible).
That is also what 99.99% of the trading community is trying with all the problems that we know. They can ONLY be profitable with such a systems true the MM.
So I decided at some point to concentrate everything on the MM instead with a +/-50% and a avg win that would be +/- equal to the avg. loss.
That means not looking for indicators anymore that would so called be profitable on there own because they do not exist. NOT 1 indicator out there.
So I looked for a random trade generator. Witch I found. My system could be looked at in the same way that one goes every other 15min long or short no matter what the trend would be. (long at 08.00h short at 08.15h long again at 08.30h...etc..) and with a T/P on that position that is equal to the T/P.
If price moves around randomly ( lets lforget about the kurtosis and skewdness and Hursts) then this should lead over a longer period of trading to a perfect B/E situation minus the trading cost and slipage.
To come back to my random trade generator. We have now in total +/- 450 trades witch gives already a pretty good idea and enough examples to make some interesting conclusions.
With the technical characteristics we have, the hitratio nearly 50% and avg win/loss ratio that is only slightly higher then 1 and if we now just use pure logics, then we should see that our system should show from all kind of trades nearly the same amount. I mean by this we shgould see more or less the same mount of trades that have 10pip profit as 10 pips loss. The same for the 20 pips profit, we should see +/- the same amount of trades who loos 20pips. and for 30a dn for 40 and for 50 and for 60.
I also am very much interested why our system produces so much profit and nearly always after a MM recovery plan. Because that MM recovery plan mathematical should lead to a B/E situation.
If I have a look to the trades that produce more then 25 pips profit and more then 25 pips loss then there is something really strange going on that is no longer in line or according the laws of a random trade generator.
1st) There are 77 trades that took more then 25pips profit and only 35 trades that have more then 25pips loss (remember we do not use an MM as other systems do with a profit target that shoud be bigger then the S/L rule. The T/P rule and S/L rule are equal to each other).
2nd) In the trades that take more then 25 pips profit we are in with an avg of 15.6 contracts and on the trades that we loos we have an avg. of 6.7 contracts.
3rd) we only have 1 losing trade that has 40 pips loss and no other trades that have more then 40 pips loss. On the winning side we have 27 trades that have 40 or plus pips profit. We go even as much as 69 pips for a profitable trade.
Included I have a spreadsheet that contain all our trades accept the 1st week.
You will find 1 page that is called Simba where i made a chart to look to the weight of the trades that have more then 25 pips in loss or profit. Also multiplyed with the acontracts that they were in on that moment.
It more then suprising to see that the weight for the winning trades is a LOT BIGGER then those of the losses.
So personaly and after looking to these results I believe there is no way to put our results into a Monte carlo or random trade generator simulator because there is SOMETHING that is just not random. Again the amount of trades more then 25pips loss and profit and not to forget the double of avg contracts on the winning side then on the losing side.
If I calculate the hitrate on ONLY these particular trades then if gives a hitratio of 68% and an avg. win/loss ratio of 5.1
Again this does not make any logic sence because all trades should show the same results with a random trade generator that has a T/P rule and S/L rule that are equal.
Hopefully those results can help you a bit.
Friendly regards...iGoR
Igor, There are people outside of your bubble that do have system that is profitable without any type of MM strategy. Most likely, it is very few. But I'm sure it does exist. There are too many ways to skin a cat. MM is not the only game in town.
Hi Kenny,
I only going to aswer this very breefly because this is off topic and before we know it we are tangled up in a discussion that has nothing to do with the topic of Michel.
I am for the scientiefic aproach. Meaning that there are people that are convinced of the existence of a god or UFO's or marsians or the paranormal etc. As long as god does not shacke my hand and or a marsian taps me on the back or a UFO lands in my back yard, I as scientists will say that they do not exist. Without offending anybody that says or believes that they do exist.
The same goes for a 100% MECHANICAL system with a more then 50% hitrate and an avg win that is bigger that an avg loss. As long as I did not see one I say it does not exist (The moment it would exist it would proof that one can predict the markets).
If you are sure it exist you can show it to me and I am more then willing to have a look at it.
But saying that you are sure without any proof is as I said for me the same as someone says he is convinsed he saw a marsian.
Friendly regards...iGoR
PS. In this link you can find the results of +/- 1500 systems over 2006, 2007 and 2008. You will not find one system with at least 50 trades that could proof the contrary of what I say.
After thoroughly studying your excel sheet I have improved it and changed it so it would match more the reality ( not reality but a bit closer). I hope you agree that is not usefull to do tests that would represent a result that could never happen in real trading.
1st) Improvement: It can only accept a MaxDD of 40%.
I don't think that somebody in reality would trade till his last $ or € goes up in smoke.
2nd) Improvement: The way I see it is that you compared my numbers and MM to other systems.
The fact that there is NO system in the world that has a hitrate of 50% and an avg winning trade that is bigger then the avg losing trade, I adjusted the numbers accordingly. I changed the avg winning trade to the same as the avg. losing trade minus the spread. That comes to avg.win 22pips and avg loss 24 pips.
3rd) Improvement: I changed the hitrate in slightly bellow 50%. Your hitrate is actually the other way around. So I changed it to 0.52 with actually means a 48% positive hitrate. That is still quite generous because the standard system with no MM rules has a hitrate well bellow 48%.
Conclusion: One does not need a spread sheet or whatever kind of calculator to know that a system with a NATURAL hitrate lower then 50% and an avg. win that is smaller then the avg winning trade will fail after a longer period of trading. With or without any compounding. That is also to be seen in the results. One can click one hundred times on the button the flat and compounding will never make it to the end.
The only 2 MM that show some profits are the martingale and my MM recorvery plan.
But as I said in my previous posting this spreadsheet takes continous the same avg. win and avg loss in its calculations. Witch is clearly not the case with our system.
That is what I explained already to Simba in mail contact with each other over the past 2 weeks that one can not put in any way our technical numbers into some random calculation. As shown in my spreadsheet there is more then a significant difference between the losses and profits above 25pips. So only looking to the avg win/los ratio and the hitrate is not the way to check out a system
BUT important is that I agree for the full 100% that I would never use my MM recovery plan on any kind of system. I would never use myself my MM on just a normal trend following system or on any system I have develloped over the past 13 years except the super-safe_Q-patern system. So it is to be doubted how good my MM is for the trading community in general.
regards...iGoROur posts were crossed...
The code of the sheet is open, you can do what you feel interesting with it.
But my goal is to compare different MM on the same strategy, so I dont see the point to have a special strategy setup for your MM and another for the other ones.
Of course the inputs parameters (the green cells) are there so everyone can input the settings of his own strategy to try to find the most suitable MM. They are made specially for that!
Anyway, I am happy if it seems usefull for you, but we can forget your system, this thread would be just about MM, not the trading strategies themself.
Best Regards,
Michel
...........Yes, its very interesting to see that your MM recover far more than the losses, and I have some idea about.
Trying to recover the losses means for any system that the bet size increases with the DD; there is no other way and this is our hypothese (unlike compounding which doesn't try to recover the losses).
So, Bet = F(DD), and we are looking for the best function F().
...........Michel,
You will need to help me out on this one. Can you explain again in words what your idea is for this behaviour.
Because the profit per single trade has nothing to do with the amount of contracts we take or the increase of betsize with the DD.
If we are in more contracts there are no rules that would suddenly change.
It is clear in the spreadsheet that the there are no losing trades one pip more then 40. But there are plenty of trades that are well above 40. Even as much as 69pips.
In an new chart I made (the image bellow) you can see the total result of all the trades that win more then 25pips but without any MM involved.
The little losing curve shows the result of the losing trades more then 25pips but again without any MM involved.
Friendly regards...iGoR
Michel,
You will need to help me out on this one. Can you explain again in words what your idea is for this behaviour.
Because the profit per single trade has nothing to do with the amount of contracts we take or the increase of betsize with the DD.
If we are in more contracts there are no rules that would suddenly change.
It is clear in the spreadsheet that the there are no losing trades one pip more then 40. But there are plenty of trades that are well above 40. Even as much as 69pips.
In an new chart I made (the image bellow) you can see the total result of all the trades that win more then 25pips but without any MM involved.
The little losing curve shows the result of the losing trades more then 25pips but again without any MM involved.
Friendly regards...iGoRThis is still about your strategy, which is not really the purpose of this thread...
From your SpreadSheet -SS-Q-patern.xls posted few posts above, sheet "NO filter", column "C", if we look to the trades (from C2 to C422) we have:
Count of winning trades: 185; Pips from the winning trades: 4443
Count of the losing trades: 234; Pips from the losing trades: -4128
The way I count is like this:
Total trades = 185+234 = 419
Probability of win = 185/419 = 0.4415
Probability of loss = 234/419 = 0.5585
Average win = 4443/185 = 24 pips
Average Loss = 4128/234 = 17.6 pips
expected return (or R/R ratio if you prefer) = 24*0.4415 / 17.6*0.5585 = 10.596 / 9.8296 = 1.078
So the "naked" strategy is very close to a random one.
I cannot say anything else; the "hitrate" concept has no meaning for me.
Now, why are you making more smaller losses and less bigger wins, I don't know because I do not trade that strategy myself, maybe something to do with the spread and the fact that the charts are Bid based, or the instinct to close the losers a little faster...
Regards,
Michel
@ Simba
Simba, thank you very much for your encouragement and your suggestions !
About the points 1,2,4, I work already on the version 2 which will include them.
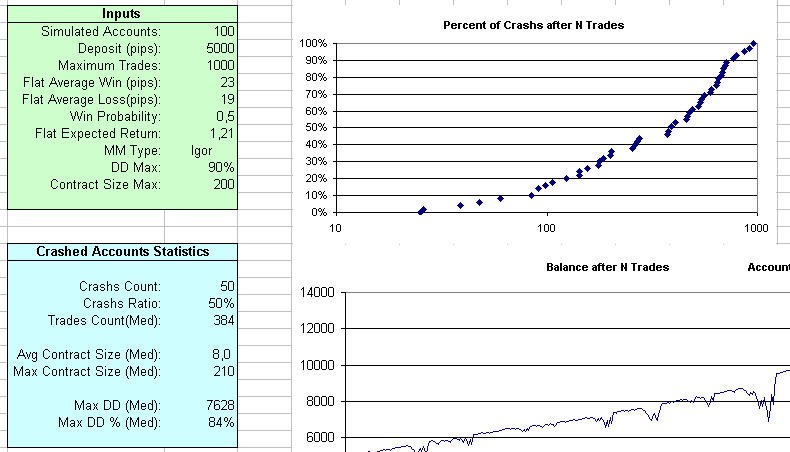
Below is a preview pict of the ruin estimator, brrr... But I still do not release that version because it is not yet finished.
I am not highly skilled in statistic, so my main difficulty is to know what kind of function I should use to interpret the results and to obtain reliable and significant informations. For example, to find the "average" life time of a system, is it better to work with the centiles or the geometrical average ?, reduced or not, and if yes how much ?, and so on...
About the point 3, it is partialy done as it is in v1: one can chose the static starting lot size for the other systems than Compound. But I have this problem: risking 19 by lot (for example) means that with a risk of 2% on a 5k account, one can start with 5 lots. But does this means that for Martingale or d'Alembert, the minimum lot size will follow the same calcul ? it seems to me that this looks like a superposition of two systems. Or do we should considere simply that the lot unit is 5 ?
Anyway, I am sure we will find something realy usefull with the help of some big brain here!
@ Igor,
Thank you for your contribution ! I am happy the you dont place this discussion on a fighting level: nor you nor me are here for that.
Yes, its very interesting to see that your MM recover far more than the losses, and I have some idea about.
Trying to recover the losses means for any system that the bet size increases with the DD; there is no other way and this is our hypothese (unlike compounding which doesn't try to recover the losses).
So, Bet = F(DD), and we are looking for the best function F().
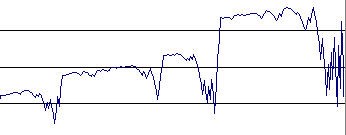
Now the graph of our trading strategy is a straight line with the expected return as slope. We can see it as the set point curve of an automatism, and the DD as the error. If the correction is too big, the system will enter in oscillation. In fact, the most suitable correction should be a PID fuction of the error which satisfy the Nyquist criterium Stability criterion - Wikipedia, the free encyclopedia
If you look to the pict below, you can see that your MM is very unstable and tends easily to oscillate, and this may be an extemelly dangerous state : you know that if you are driving a little drunky, if you are going to much to the left side, you suddenly correct it, but too late and thus too much, so you are going now too much to the right side and so on... Nobody can say which one of the left or right wall you will hit...
Best Regards to both of you
Michel
...
Nice work Michel. But then, you always do your work that way 
regards
mladen
..........
Now, why are you making more smaller losses and less bigger wins, I don't know because I do not trade that strategy myself, maybe something to do with the spread and the fact that the charts are Bid based, or the instinct to close the losers a little faster...
Regards,
MichelA LOT MORE bigger wins.
And no instincts involved because it is a 100% mechanical system.
And that bid based and spread fact counts as much for the long trades as for the short trades. as much for the winning trades as the losing trades.
But forget about it because this is not what your topic is about. I tought that you explained in that previous posting the reason why I have a lot more bigger wins then bigger losses. But I must have misunderstood your.
Friendly regards...iGoR
- Free trading apps
- Over 8,000 signals for copying
- Economic news for exploring financial markets
You agree to website policy and terms of use
To recover the losses is an old gambler's dream, but if the expected return of a strategy is greater than 1, one can try to optimize the usage of one's deposit.
Its a very complicate matter, for example, a stratey winnig 40 and losing 10 with a win probability of 0.25 has a totally different behavior than another one winning 10 and losing 10 with 0.57 as probability of win, yet both have the same expected return 1.33.
If there are great mathematicians here who can predict how their system will perform until next year, I am not that much intelligent.
That's why I wrote this Excel sheet to simulate the behaviors of few techniques, the most known, to study and compare them.
If one can read "between the lines of the graphs", there are many interesting stuff to discover...
The idea is to generate a random sequence of wining and losing trades based on an input statistic, and to see what happend to the accounts, each one being managed by a particular system and using the same sequence.
The calculations of the accounts are made by formulas, so it's easy to modify one of them or to add a new one, so everyone can test his own system.
Each serie makes actually 1000 trades, but duplicating the last rows, its possible to go far more than that.
Its possible to modify the input parameters (the green cells) independently from the random sequence, and this is usefull to see how their impacts on the performance are; the accounts are recalculate "on the fly" if this is checked in the Excel's options.
Now, this tool is version 1. The next step will be to generate many series of random sequences so it will be possible to study statistically the systems (for example, to know the number of trades it can do, or the initial deposit, before having a probability of 0.9 to crash).
The step after will be to write a full Monte Carlo optimizer of the inputs parameters for a given system.
I let those who are intersted playing a little bit with this toy, and we will continue the discussion after.
All comments or suggestions are welcome!
Michel