Best indicator/methodology for finding peaks?
Thanks.
It's very interesting.
Just played with the settings of this indicator (xbars settings):

Thanks.
It's very interesting.
Just played with the settings of this indicator (xbars settings):
Just don't get too overexcited, most of my stuff is really quite simple (simpler is better IMHO)
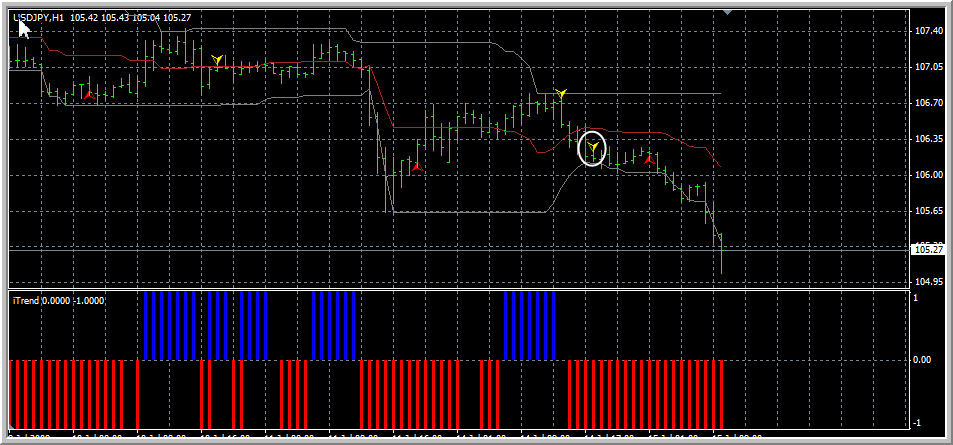
Just to point how it works, it just looks for a point when the bar has touched the donchian channel X bars ago and not since.
I was thinking of using a similar method to find a max/min point of chart between last up/down arrow to find peaks. That's why I posted the indicator, just as an example.
Maybe something like this?
Thanks for that but I'm a bit unsure how I can use that mechanically to find peaks.
There is a "famous" pattern that occurs at some tops/bottoms.
For a long trade...a bar makes a new low, followed by an upclose(can be on the same bar), followed by a downclose that does not break the low...your entry is a few pips above the high of the downclose...a variation on this entry is if it makes another low(still not breaking the original low) you can enter on a break above the high of the newest low...However, I believe the original version has the orignal high of the first downclose as entry point.
Reverse for a short trade...
Some other things I have observed about this pattern...I think it works best when not too many bars make up the pattern, the pattern occurs at a support/resistance point/area, and price has not traveled too far from the extreme that started the pattern.
Maybe also to be used during volatile market hours if trading intraday...try it out on a 15 min chart in conjunction with a pivot point indicator or daily camarilla line indicator.
I'm not a programmer so I don't have this pattern programmed.
Hope this helps 
There is a "famous" pattern that occurs at some tops/bottoms.
For a long trade...a bar makes a new low, followed by an upclose(can be on the same bar), followed by a downclose that does not break the low...your entry is a few pips above the high of the downclose...a variation on this entry is if it makes another low(still not breaking the original low) you can enter on a break above the high of the newest low...However, I believe the original version has the orignal high of the first downclose as entry point.
Reverse for a short trade...
Some other things I have observed about this pattern...I think it works best when not too many bars make up the pattern, the pattern occurs at a support/resistance point/area, and price has not traveled too far from the extreme that started the pattern.
Maybe also to be used during volatile market hours if trading intraday...try it out on a 15 min chart in conjunction with a pivot point indicator or daily camarilla line indicator.
I'm not a programmer so I don't have this pattern programmed.
Hope this helps Very interesting post. Thanks.
FerruFx
Maybe something like this?
Very nice one. Thanks.
FerruFx
Hey Mikkom,
Maybe look for "cycle point Kroufr" :
https://www.mql5.com/en/forum/176577/page3
And look for the explanations :
Thanks Joe!
Those seem to be pretty good, I'll go through the code and see how they work 
I replied this in private message but I thought it would be a good idea to post this here too so everyone would understand what I'm really looking for here..
I'm really not looking for the holy grail, I don't mind if the indicator paints the peaks 2 or 3 bars after they appear.
What I want to find is patterns of higher highs and lower lows and do a statistical test on what correlation does higher highs with lower lows have to next peak.
My hypothesis is that the next peak will also be a higher h or lower l with a significant percentage difference.
If this is true, then programming a solid good performance EA will be easy if we have a working peak indicator
I replied this in private message but I thought it would be a good idea to post this here too so everyone would understand what I'm really looking for here..
I'm really not looking for the holy grail, I don't mind if the indicator paints the peaks 2 or 3 bars after they appear.
What I want to find is patterns of higher highs and lower lows and do a statistical test on what correlation does higher highs with lower lows have to next peak.
My hypothesis is that the next peak will also be a higher h or lower l with a significant percentage difference.
If this is true, then programming a solid good performance EA will be easy if we have a working peak indicatorI understand what you're looking for. Fractals with a combination of CCI and Stochastics works pretty well.
- Free trading apps
- Over 8,000 signals for copying
- Economic news for exploring financial markets
You agree to website policy and terms of use
Hi all,
I'm trying to find an indicator that finds peaks and bottoms. I'm aware of fractals but I don't think that it's very accurate, too many false peaks.
I have experienced with some indicators, donchian channels reversed by some % is quite good (wpr is good for this) as is bolligner bands reversal (CCI is the indicator to look for this) but I'm looking for more ideas.
I don't mind if the peak is recognized only few bars or pip movement later - what I want to do is mechanically test some peak patterns (higher highs + lower lows and so on) with a very long period of data.
I'll probably be programming my own indicator to find peaks and after that I'll post it here if I get some good ideas.
Just an example for an idea: attached is one of my indicators that uses donchian channels to find short term reversals, I think something like this will be good start (find max of previous bars before the reversal signal).