Pipchannel indicator
hi
thanks for posting your indicator , i'll compare it with camarilla line 
===================
Very Cool
Thank you very much Mikkom for this nice channel indicator, it rock my socks off


How is the Pip Channel indicator different from the SWEETSPOTS GOLD indicator which will draw horizontal lines at prices ending in 00 and 50?
couldn't resist :
(sorry, Mikko, spoiling your indi)
pip chan levels (if=pip move(step)- shows chan breakout value
How is the Pip Channel indicator different from the SWEETSPOTS GOLD indicator which will draw horizontal lines at prices ending in 00 and 50?Please read my original post, this indicator is basically P&F projected to chart.
To understand p&f, please read for example Understanding Point & Figure Charts - StockCharts.com
Dear Mikkom and other creators,
I just joined Elite forum for about 3 months ago. So far, I have received many great indicators from you all with deep appreciation.
Last week, I just bought an ebook named "Point and Figures trading system used to trade forex and spot gold" from a professional trader. His website is: Forex Point and Figure System (FxPnF) - Order
His e-book is really very detailed in explaining about the different ways of trading forex by using PNF trading system, but it is very heavy (about 20 mb).
So, I can not upload it here, but I am willing to send it to any creators who are interested in creating perfect PNF indicators. So, please kindly give me your email address so that I can send it to all of you who are interested.
In his manual trading system, he describes very well about all entry, trailing stop, and exit strategies.
This man used to be a professional stock trader in New York before, and he applied this PNF trading method in forex in recent years.
Well, he also has 2 PNF indicators (but sorry that no alert), and I can send them here for all of you to study the try to more it to be able to project and signal the good opportunities for a Buy or a Sell trigger.
I hope that you can put an alert sound when a Buy or a Sell signal is created / or going to occur (for example: some common PNF Patterns such as: Double-top breakout, double-bottom breakout, triple-top breakout, triple-bottom breakout, etc).
The PNF system should be best used on the Daily chart.
Please find herewith 2 versions of PNF Custom Indicators for your further coding.
Thanks and regards,
James
Please read my original post, this indicator is basically P&F projected to chart. To understand p&f, please read for example Understanding Point & Figure Charts - StockCharts.com
Thanks for responding.
I appreciate your time.
- Free trading apps
- Over 8,000 signals for copying
- Economic news for exploring financial markets
You agree to website policy and terms of use
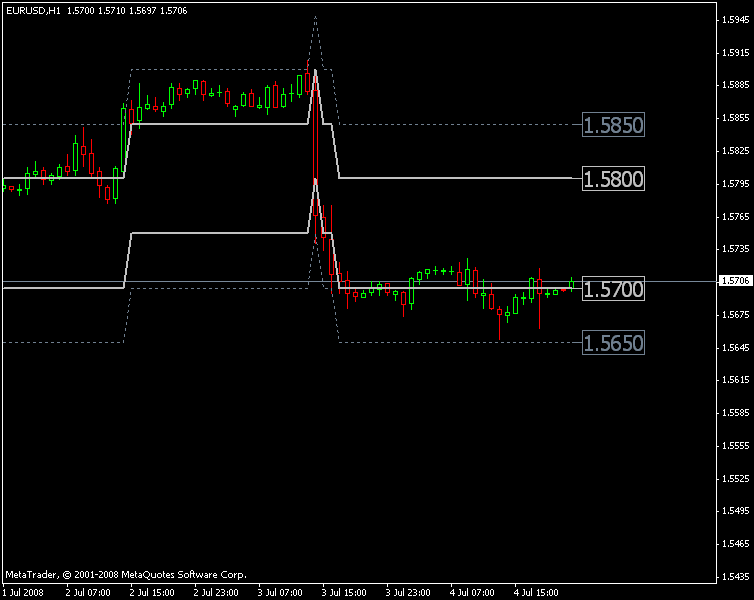
Hi all,
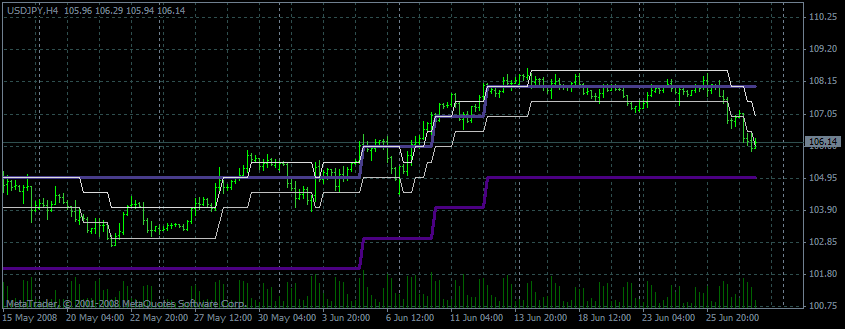
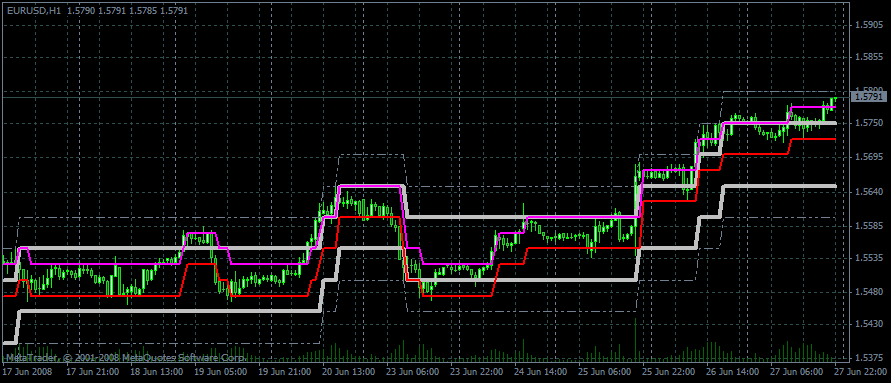
Here is another quite simple and efficient indicator. It's basically point & figure projected to the chart as a channel (with adjustable size - below is 50/100 and one with many different wide channels on same price).
If you look at the channel, it's also always located at solid levels, if you use 50 point pipsMove then it's always at solid 50 levels, if you use 100 points, it's always at solid 100 levels. This may sound not so important but remember that the round numbers are psychologically important levels.
Also it's very important to note that because this indicator is solely based on pip movement, it's timeframe independent. So lines on 5 min chart are the same as lines on daily and so on.
Very simple, very efficient like all the best indicators
Screenshot and code attached.