RSI ATR system from TASC
ND,
Thank you for a prompt response.
I would like to have an audio/email alert added so that when I am away from the computer I will be notified. It would be nice if the email could contain the pair and the entry/stops as well as the ohlc of the candle that gave the signal.
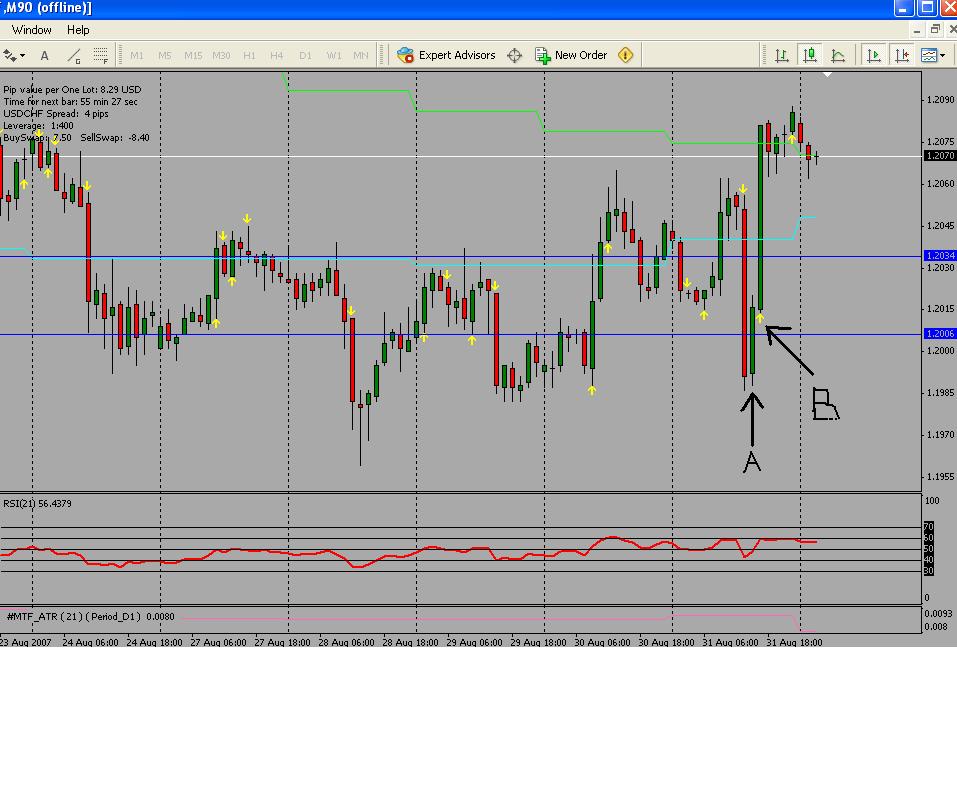
I also dont think that the lines are set properly. As neta1o stated it takes the current bar for the entry/stop lines but I dont see why this is done since we dont get a confirmation of a trade until the bar closes and rsi goes above or below the 50 line. If you look at my picture it might help. (A) is the bar that the entry and stop is taken from and (B) is where we actually get the signal(arrow).
Also, You cannot draw your own trendlines. It seems that when you do the indicator will delete them on every new tick. This can be a hassle if you like to add your own trendlines to the chart.
I hope that someone will be able to help with these additions. I have been using this strategy for quite a while. Also attached will be the indicator being used. Thank you for any and all help.I hope someone can help get this coded correctly and working properly because it really is a great strategy.
I'm just getting into programming MQL, and this is my first indicator and my first post in this forum.

I've attached the article and my indicator. I'll be making and EA of it soon. Any input is appreciated. Glad to be a part of the community.
Note: Use this on the H1 or H4 chart, any currency pair is fine.
Shows horizontal lines with last stop and entry. First blue/red arrow is entry indicator, second blue/red arrow in same direction is to add to position.
Green check mark is to close 1/2 of position. Close other 1/2 at opposite colored arrow. I'll explain more soon.The complete article from TASC and the first version of the indicator made by neta1o.
Yes it is a good system. It is a shame there isnt much interest in it especially with it being HUGELY profitable.
traderjai_inhi, how have you been doing trading this system?
This update should help, let me know if there is anything else that could be tweaked.
Note, keep an eye out for the green check marks to close (they are pretty small and hard to see)
Also, use your discretion on closing, if your happy with a certain pip gain/loss go with that. Money Management...
I've been working on converting this into an EA and there is a lot of losses during the sideways price movement but the
big runs are big winners. Easier to see these trades with the eye than with a robot (EA). Still working on that and will post soon.
Enjoy..........
Bump
Guess this didn't work out, seems like a great 4 H system, no one has the patience I suppose.... 
How do we know this is a good system if no trades have been posted about it on this forum? Could be outdated, but also could be great but how would we know.
I find it interesting though, and will test it out and post some trades or interesting things I find.
Over time I have evolved the strategy and have continued to use variations of it to good effect.. The 4 hour works well for those that want to get in near the beginning of a trend. With some tweaking it is also useable on lower time frames as well.
Attached is an indicator I found that helps show on the chart when rsi goes above/below 50 and it might help to visualize the strategy better.
i think this system is interesting ...i mean it can be very profitable if the best combination of indicators is found...I guess this best combination is the usage of rsi chart bars with Braintrend 2sig and another indicator with the name Trend signal.They are uploaded below...The entrance of a sell/buy order will be done when the three indicators show the same direction...
entarance : rsi chart bars + braintrend 2sig + trendsignal (they shud appear on the same bar)
exit : braintrend2sig
By the way its just a suggestion....i just put thse three on the chart on H4 timeframe...and looks good...
i think this system is interesting ...i mean it can be very profitable if the best combination of indicators is found.....
Hi Selym
Thank you for your input. What initially drew me to the strategy was the simplicity of it by following a single main indicator. What is so great about it is that it does allow for individual traders to tailor it to suit their needs.
I will take a look at your suggestions.
- Free trading apps
- Over 8,000 signals for copying
- Economic news for exploring financial markets
You agree to website policy and terms of use
Hello,
This system premiered in Technical Analysis of Stocks and Commodities magazine in Aug of 2006. I hope someone can help make this into a fully functioning indicator. Here are some post on what has been done and what still needs work.
Please help to code the following simple medium term strategy. This strategy is from August '06, Technical Analysis of Stocks & Commodities magazine.The author is Jamie Saettele.
He publishes a 3 1/2 year Tradestation back test that shows a $1,000 account growing to $71,300 in the 3 1/2 years. The equity curve is very smooth, with no major drawdowns.
Strategy:--------------------------------------------------------------------------------------------------------------------------------------------------------
Chart: EUR/USD, H4
Indicators: RSI(21), ATR(21) on D1 Chart
Buy Setup:
Buy when RSI(21) Closes Above 50
Buy Stop Entry:
Enter Buy Stop at the high of the bar that caused the RSI cross above 50 + 15% of the Daily ATR(21). 15% of the Daily ATR on EUR/USD will be around 15 pips.
Stop Loss/Buy Stop:
The Stop Loss will be the Entry Price minus 30% Daily ATR(21). About 30 pips or a signal to go short.
Open 2nd Lot:
Add another lot, Market Order, when the RSI crosses above 60 on the close. The Stop Loss for this second lot is the RSI falling below 50.
Close/1st Lot:
Close half the trade when the RSI crosses above 70 and then falls back below it.
Stop Loss/2nd Lot:
The Stop Loss for the remaining half of the position is a signal to go short OR the RSI falling below 40.
Sell Setup:
Sell when RSI(21) Closes Below 50.
Sell Stop Entry:
Enter Sell Stop at the low of the bar that caused the RSI cross below 50 - 15% of the Daily ATR(21). 15% of the Daily ATR on EUR/USD will be around 15 pips.
Stop Loss/Sell Stop:
The Stop Loss will be the entry price + 30% Daily ATR(21). (About 30 pips) OR a signal to go long.
Open 2nd Lot:
Add another lot when the RSI crosses below 40 on the close.
Stop Loss 2nd Lot:
The Stop Loss for this second lot is the RSI crossing above 50.
Close 1st Lot:
Close half the trade when the RSI crosses below 30 and then crosses back above it.
Stop Loss 2nd Lot:
The Stop loss for the remaining half of the position is a signal to go long OR the RSI rises above 60.