Simple 5/8 crossover daily chart
try using your strategy but based on #MAMA cross, I think this gives less false signals...
thanks for the reply.. how does that work ?
You may use this indicator https://www.mql5.com/en/forum/general for arrow and alert: just change UseAlert to true, ShortPeriod to 5, BigPeriod to 8, BigPeriodMode to 1, DeltaForSell to 0 and DeltaForBuy to 0.
You may use this indicator https://www.mql5.com/en/forum/general for arrow and alert: just change UseAlert to true, ShortPeriod to 5, BigPeriod to 8, BigPeriodMode to 1, DeltaForSell to 0 and DeltaForBuy to 0.
Great, thanks :-)
I like yous strategy because it's very simple.
Do you use it everyday ?
I like yous strategy because it's very simple. Do you use it everyday ?
Not everyday no.. I wait for the signals. Some days I get them on more than one pair, other days I don't get them a signal for a few days. You need to be patient and disciplined.
You may use this indicator https://www.mql5.com/en/forum/general for arrow and alert: just change UseAlert to true, ShortPeriod to 5, BigPeriod to 8, BigPeriodMode to 1, DeltaForSell to 0 and DeltaForBuy to 0.
I tried adding the cross and #mama indicators on my MT4 demo under experts/indicators, but I don't see them...Am I missing something (in order to make it work properly)?
TIA!
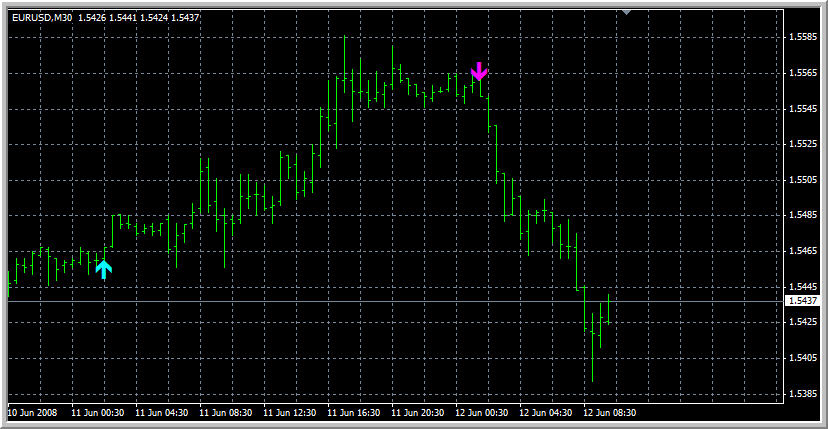
You should see the arrows with PeterM's settings (see my previous post):
What is DeltaForSell and DeltaForBuy?
It is
- BigPeriod moving average (ema, sma, lwma and so on) + delta in pips for buy
and
- BigPeriod moving averages minus delta in pips for sell.
It means the following:
If ShortPeriod MA is crossing BigPeriod MA plus delta in pips for long - it is buy arrow.
If ShortPeriod MA is crossing BigPeriod MA minus delta in pips for short - it is sell arrow.
So, this DeltaForSell and DeltaForBuy together with BigPeriod MA is a channel. It means that ShortPeriod MA is crossing BigPeriod MA channel.
But you will see just the arrows only (with alert).
There are many other indicators here https://www.mql5.com/en/forum/general
Thanks New Digital! 
..............
- Free trading apps
- Over 8,000 signals for copying
- Economic news for exploring financial markets
You agree to website policy and terms of use
I have been using a strategy for a few months now. It is very simple and I have followed the rules exactly. Its certainly not holy grail but it has made me some nice pips over the last few months.
I use the 5 EMA and 8 EMA crossover on the daily chart. For the stop loss I use the low or high for the previous day (depending on if we are or short). Alternatively if this is too close or too far away, so the risk/reward ratio would be too low, I draw fib lines on the daily chart and trendlines to try and pickout important support and resistance points and place the stops at these. I always give priority to points where the market has bounced previous. I usually place the stop just above or below these points.
I have used it on these pairs: NZD/JPY, NZD/USD, GBP/JPY and GBP/USD. It has worked best on these pairs in the past.
For the take profit, I trail it, usually by 50 pips on nzd/jpy , 100 on GBP/JPY and 50 on GBP. It loves trending markets but doesnt work to well in ranging markets, however as I used strategic stops and tps, The losses have been very small when the market ranges, sometimes even a small profit. On the plus side it has picked up and rode some nice trends. I picked up the first part of the major carry unwinding on gbp/jpy and nzd/jpy for some very very nice pips, A nice gain on equity whilst not risking too much. I had the sell signal on GBP/USD but that one got stopped out at +2 pips.
I am currently watching NZD/USD and waiting patiently to see if a buy signal comes along. Has anyone else tried this strategy or something similar?