Simple breakout system needs EA & further testing
Reply to Shinigami
Thank you for taking time with this. I question whether you have tested over a sufficient data set, maybe the rules are misunderstood or possibly different data to that used in my test. The reason i question this is the drawdown i experienced was around 30% over a small testing period, allowing for slippage. I will laboriously manually test the previous three months on the GBP/USD using prorealtime data and post my results. Once again thank you for your time.
25 % in last three months
I have manually back tested the last three months ( April, May, June ) The results a little over 25% profit risking 5% each trade with a 3 point spread and allowance of 2 point slippage per trade. Maximum drawdown was a little under 16%
This may be a basic robust system which can be improved upon. Although slippage could be a problem. My expectation is that some years this system may take small losses but in the long run provide reasonable returns. Back testing would help in the verification / development or prove the system untenable.
hi oneandl , can you post pictures of graphs of different scenarios as visual aids. i am having trouble understanding this set-up?
In your analysis, how did this do in a range bound market?
Although this is not truly a trend following system it performs better during trending periods which will inevitably come. It does not perform so well when the price moves eratically in a small range. Drawdowns are to be expected, just as tight ranges and trending movement are to be expected. I like you wish to see this system accurately back tested over the last 10 years to show the maximum drawdown encountered. The largest drawdown i experienced during an erratic tight range was around 30 %
I experience approximately the same drawdown when using 5% risks - 30%.
But I never tested my systems on longer time periods than 3 years, while usually I test them with 1,5 years. I think that market changes a bit every year or two and you have to keep up with it. If you optimize something to have small drawdown on 10-year period, you might be losing an opportunity to get much more profit with same drawdown.
Thats my humble opinion.
et_phonehome_2
usually any breakout system keeps losing in a ranging market. Unless you can identify the start and the end of ranging market and trade to the inside instead of outside (by using buylimit instead of sellstop and selllimit instead of buystop).
- Free trading apps
- Over 8,000 signals for copying
- Economic news for exploring financial markets
You agree to website policy and terms of use
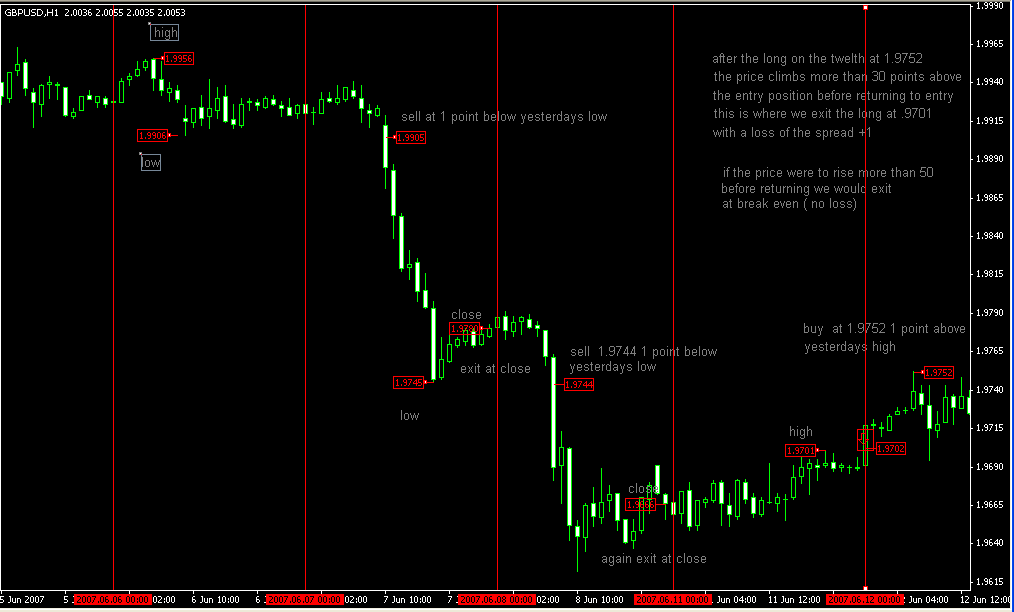
I have developed two systems some time ago. I recently viewed Fxigors dynamic breakout system which left me wondering if the following system could incorporate some of his ideas. The reason for the second system is my concern for the cost of trading once a day ( slippage & spread costs) The intention of the second system is to trade less, decrease the draw down and costs, although missing many good moves. The idea for both systems is to get somewhere approaching a 50% success rate on winning trades with higher average wins than losses. The systems needs back testing over a significant period to determine the drawdown. The rules for the first system follow. There are two types of entry and exit.
Buy1 Entry rules
If price crosses above yesterdays high buy
No entry if a buy1 has previously been triggered today
No entry if a buy2 is open
No entry if price has previously (today) crossed over yesterdays high (this
may happen after a buy2 entry)
A buy1 entry closes any open short positions
Buy2 Entry rules If price falls greater than x points below open then returns to cross over
open then buy
No entry if a buy1 position is open
No entry if a buy2 has previously been triggered today
A buy2 entry closes any open short positions
Rules to exit buy1 positions
If price rises after a buy1 entry greater than x points above yesterdays
high then returns crossing under yesterdays high OR price rises greater
than x points above open then returns crossing under open exit buy1
position
Rules to exit buy2 positions
If price falls after buy2 entry below todays low Or price rises after buy2
entry greater than x points above open then reverses crossing under open
OR price rises after buy2 entry greater than x points above yesterdays high
then reverses crossing under yesterdays high Exit buy2 position
The rules for sell entry and exit are the opposite of the above rules.
All positions are closed at the close of the daily bar although it is possible
to hold and wait for one of the rules to close the position. I used 30 for
the value of x on the GBP/USD. The SL is 50 excluding spread. Neither of
these values are set in stone. Other values may be more efficient. There
are other rules which may decrease the drawdown but i am unsure when
developing them if i am guilty of curve fitting. One for instance is to exit
the position should the trade return after five hour bars or the trade be in
negative territory after the same period.
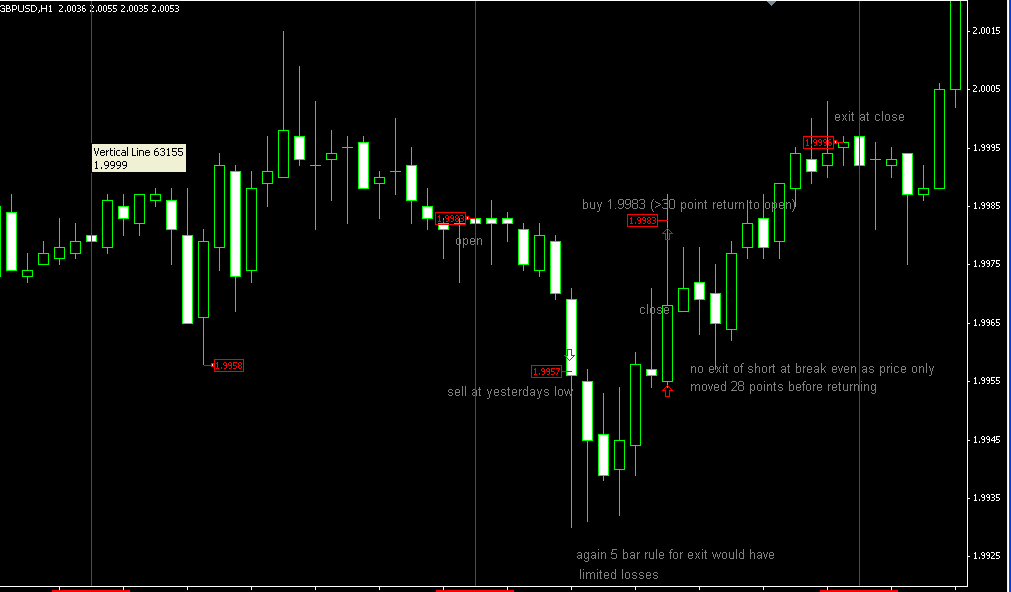
The second system is very simple. Enter if price rises or fall greater than 50 points above open on daily bar then returns to cross open . The trade is held until a profit target of 200 is reached. The trade is closed should it move more than 30 points in the direction of trade then return to entry position or a return to entry after close. The SL is 50. These figures can be changed. The target can be decreased to 100 providing more hits but less reward. I only tested this manually over a very short period with six winning trades and six losing trades along with 8 break even trades. The average win was 200 while the average loss 50 tested on GBP/USD with these figures. I have found manual backtesting difficult. It is easy to lose concentration and finding different results each time requires much revision of the same data. If any one would take the time to code an EA for these systems please do so and leave here. I have seen returns over two months of 100% risking 5% of capital per trade (considering the SL is 50 points) for the first system. This period was May and June 2006 where June was a difficult period for this system. This method need much further testing. I have explored Elliot Wave theory and used software packages such as Elwave and MT Predictor. My belief is predicting the market is at best fifty fifty. The concepts of trend following and acceptance of the randomness of movement are core to the development of this system. The longer the time period of trend traded, the less the costs of transactions. Money management and fine tuning may improve this system which is an attempt to profit from larger movement. For price to rise or fall it must pass a previous high or low. If you look at a daily chart you will notice the wicks above and below the open. The system attempts to enter if a wick is greater than a certain amount on return to the open as well as highs and lows.