Candle Average Strategy
Hi,
to begin EA's development I've written CandleAverage indicator for MT4.
Looks interesting.
Igor
Hi,
to begin EA's development I've written CandleAverage indicator for MT4.
Looks interesting.
Igorwill you please explain to me what is the meaning of " Candle Average = 31 SMA of BarValue "
Thanks
...
Hello... I'm little confused too, what's that mean Candle Average = 31 SMA of BarValue
will you please explain to me what is the meaning of " Candle Average = 31 SMA of BarValue " Thanks
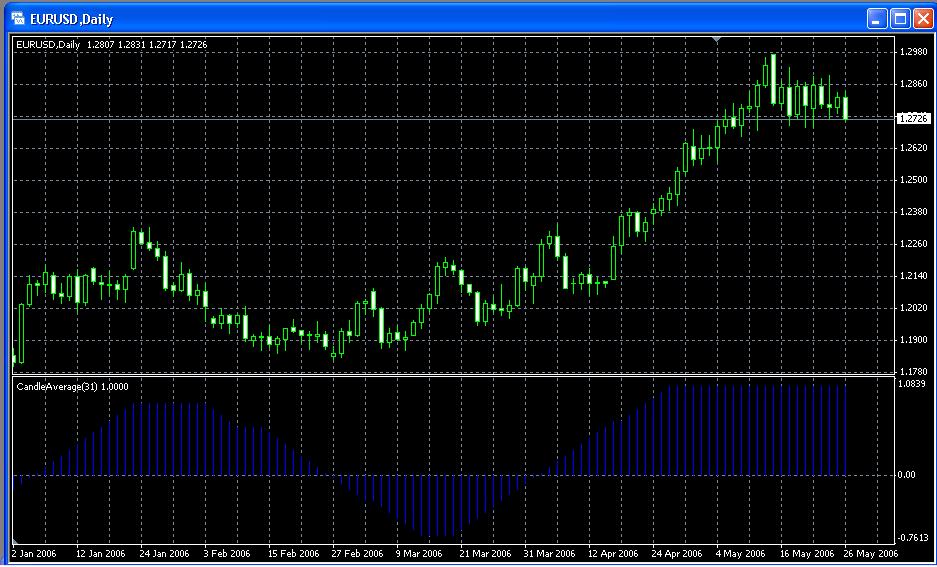
Candle Average have simple formula:
1. If High-Close < Close-Low then BarValue = 1 ,i.e. current Close is in upper part of candle ( for uptrend)
2. If H-C > C-L then BarValue = -1 - Close in lower part of candle (for downtrend)
3. If H-C = C-L then BarValue = 0 - Close is in middle of candle (for sidetrend)
After BarValue array is formed for each bar we apply averaging by Simple Moving Average(SMA) with period 31 (or different).
Igor
Candle Average have simple formula:
1. If High-Close < Close-Low then BarValue = 1 ,i.e. current Close is in upper part of candle ( for uptrend)
2. If H-C > C-L then BarValue = -1 - Close in lower part of candle (for downtrend)
3. If H-C = C-L then BarValue = 0 - Close is in middle of candle (for sidetrend)
After BarValue array is formed for each bar we apply averaging by Simple Moving Average(SMA) with period 31 (or different).
IgorIgor
I think that H,L,C is not High, Low and close. Look of what he said:
H=25 EMA based on High
L=27 EMA based on Low
C=9 EMA based on Close
h = iMA(NULL,0, 25,0, MODE_EMA, PRICE_HIGH, i);
and not the high price of the candle
I changed your indicator, but I really don't know which is the correct one. Tell me what u think.
Hi elihayun,
You are right, but the sense of this indicator is such as I've described.
I've added H, L , C periods into code.
IgorJust one thing, according to his description the period of the Close is 9.
It seems to be an early indication, which is good.
Hi elihayun,
You are right, but the sense of this indicator is such as I've described.
I've added H, L , C periods into code.
Igor
P.S. I've uploaded the version without bugs.
Hi elihayun,
You are right, but the sense of this indicator is such as I've described.
I've added H, L , C periods into code.
Igor
P.S. I've uploaded the version without bugs.Igorad & Elihayun,
Thanks so much for the indicator, you have perfectly emulated the histogram in Wealthlab. Hopefully the EA can be formulated soon. Great effort - thanks.
- Free trading apps
- Over 8,000 signals for copying
- Economic news for exploring financial markets
You agree to website policy and terms of use
First, let me say I have been a WealthLab user for many years and believe it to be the most reliable testing platform out there. I have been dabbling with Forex for about two years now and decided to try to apply the massive library of Wealthlab scripts (Chartscripts) to various currencies. The program provides a wonderful ranking system to filter out what works best among hundreds of scripts and variables.
I came upon a rather annonymous Chartscript called “Candle Average” that, when optimized for each currency, provided surprisingly good results as a long term day strategy.
http://www.wealth-lab.com/cgi-bin/WealthLab.DLL/editsystem?id=36567
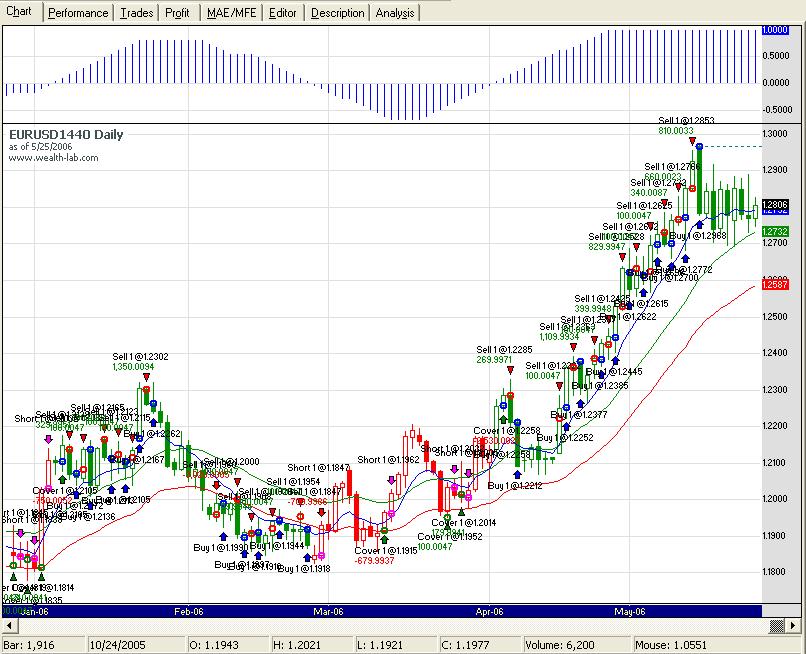
It simply uses three EMA values based on High, Close, and Open, computes an average and assigns a short/long strategy to take a single position at the start of the next day. Exits are either time-based or profit target. I played around with stoploss but found it didn’t substantially help the drawdown.
I modified the script for optimization and back tested daily data from July 1998 to present and have posted just the Euro tests below. Win ratio is about 80% at worst and over 90% at best. I’m a Wealthlab programmer and not too proficient with MQ4. I’m looking to possibly run this in MQ4 so forward testing and refinement can be done. It looks like it might easily be adapted to MQ4 for demo testing while I continue to optimize in Wealthlab – since optimization in Metatrader is very inefficient. So if there are any MQ4 programmers out there who would like to experiment with me and the forum, let me know.
In closing, it appears to show a profit curve that everyone wants – a nice somewhat linear growth with no large spikes. I imagine this method might can be improved and adapted to different timeframes. On paper, it looks promising anyway!
-----------------------------------------------------------------------------------------------------------
Ok here’s the breakdown of the code. I’ll use the Daily Euro example…
H=25 EMA based on High
L=27 EMA based on Low
C=9 EMA based on Close
If H-C < C-L then BarValue = 1
If H-C > C-L then BarValue = -1
If H-C = C-L then BarValue = 0
Candle Average = 31 SMA of BarValue
I have a Histogram Indicator that plots Candle Average (see top of Euro_Chart.jpg).
Entry Rules….
If Candle Average > 0 and there is no active position…
Go Long at next market open and cover any open short.
If Candle Average < 0 and there is no active position…
Go Short at next market open and sell any open long.
If Candle Average = 0 no action.
Exit Rules…
You will never take a position and close it the same day. After a position is taken, profit target (10 pips) is calculated at the end of the day and is activated at the next day’s market open – usually the end of one day and open of next is the same – except over weekends. If profit target is reached, close and re-enter based on above rules.
TimeBased exit occurs so as to never hold a position longer than 9 days.
---------------------------------------------------------------------------------------------------------------
That’s it. Pretty simple but it slowly seems to work.
If you look at my Euro_Chart.jpg you can see some positions taken…
Blue Upward Arrow = Long Buy
Pink Downward Arrow = Short Sell
Red Downward Triangle = Sell Long (Red Circle = Price)
Green Upward Triangle = Cover Short (Green Circle = Price)