Volatility indicators for MT4 - page 6
You are missing trading opportunities:
- Free trading apps
- Over 8,000 signals for copying
- Economic news for exploring financial markets
Registration
Log in
You agree to website policy and terms of use
If you do not have an account, please register
Здесь.http://forum.forexac.com/showthread.php?t=238830&
Thanks for the link
Volatility Spike Indicator
Hi,
Can someone please create the indicator for the sigmaspike indicator explained below:
SigmaSpikes is a tool to express each bar’s return against a volatility-adjusted baseline, as a standard deviation of the last 20 bars’ returns. This highlights significant moves that might or might not be apparent based on visual chart inspection. It is also a useful tool for traders monitoring many markets on a daily basis, as measurements under, say, 1.5 or 2.0 on this tool can usually be considered normal fluctuations, and very large readings will demand immediate attention. It is important to note that, though this measure uses standard deviations, no claim is being made that the data follows a normal distribution. This means that the standard statistical rules of thumb (e.g., roughly 95% of values are within +/- 2.0 standard deviations) do not apply to this tool.
There is a blog post called Chart of the Day: Breakout in the S&P and also Chart of the Day: Gold which explains more about it with a chart.
Thank you very much
Hi,
Can someone please create the indicator for the sigmaspike indicator explained below:
SigmaSpikes is a tool to express each bar’s return against a volatility-adjusted baseline, as a standard deviation of the last 20 bars’ returns. This highlights significant moves that might or might not be apparent based on visual chart inspection. It is also a useful tool for traders monitoring many markets on a daily basis, as measurements under, say, 1.5 or 2.0 on this tool can usually be considered normal fluctuations, and very large readings will demand immediate attention. It is important to note that, though this measure uses standard deviations, no claim is being made that the data follows a normal distribution. This means that the standard statistical rules of thumb (e.g., roughly 95% of values are within +/- 2.0 standard deviations) do not apply to this tool.
There is a blog post called Chart of the Day: Breakout in the S&P and also Chart of the Day: Gold which explains more about it with a chart.
Thank you very muchWhat is the "returns" part from this "standard deviation of the last 20 bars’ returns"
What is the "returns" part from this "standard deviation of the last 20 bars’ returns"
I think the "returns" part is the close(today)-close(yesterday) or close(today)-open(today) because he wrote in the S&P post: "One of the tools I use to evaluate market action is the standard deviation spike, which expresses each day’s return a standard deviation of the previous 20 trading days"
He also wrote: " It is important to note that, though this measure uses standard deviations, no claim is being made that the data follows a normal distribution. This means that the standard statistical rules of thumb (e.g., roughly 95% of values are within +/- 2.0 standard deviations) do not apply to this tool." I think that is interesting feature of this tool.
I think the indicator calculates the close-close or close-open for each day for 20 days then works out how many standard deviations todays price change is compared to the last 20 days. Anything above 2 SD is abnormal and you pay attention.
Thats the way i see this interesting indicator. Hope that is helpful.
Thanks
I think the "returns" part is the close(today)-close(yesterday) or close(today)-open(today) because he wrote in the S&P post: "One of the tools I use to evaluate market action is the standard deviation spike, which expresses each day’s return a standard deviation of the previous 20 trading days"
He also wrote: " It is important to note that, though this measure uses standard deviations, no claim is being made that the data follows a normal distribution. This means that the standard statistical rules of thumb (e.g., roughly 95% of values are within +/- 2.0 standard deviations) do not apply to this tool." I think that is interesting feature of this tool.
I think the indicator calculates the close-close or close-open for each day for 20 days then works out how many standard deviations todays price change is compared to the last 20 days. Anything above 2 SD is abnormal and you pay attention.
Thats the way i see this interesting indicator. Hope that is helpful.
Thankstradewiser
If "returns" is close(today)-close(yesterday) then that is a simple momentum(1) (if he uses average of it then it would be an average(momentum(1),20)).
Anyway will see if some more information is available since this way there are too many questions
tradewiser
If "returns" is close(today)-close(yesterday) then that is a simple momentum(1) (if he uses average of it then it would be an average(momentum(1),20)).
Anyway will see if some more information is available since this way there are too many questionsMladen
I see what you mean now. I'm not really sure what he really means but I think each days "returns" is close(today)-close(yesterday).
Mladen I see what you mean now. I'm not really sure what he really means but I think each days "returns" is close(today)-close(yesterday).
tradewiser
Then it is just another way of calculating the momentum and the built in momentum can be used instead
tradewiser Then it is just another way of calculating the momentum and the built in momentum can be used instead
ok, thanks
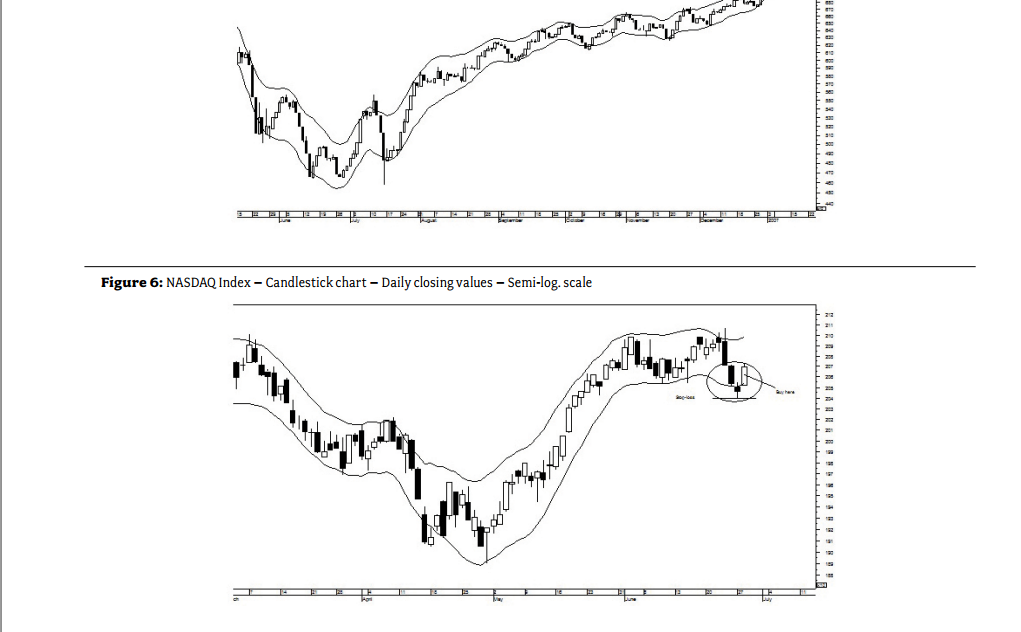
Volatility-Based Envelopes by Mohamed El Saiid
Has anyone heard of this VBE indicator? I played with it on a bloomberg terminal and found it to be quite useful.
It is created by Mohamed El Saiid, who is the Head of Technical Analysis Dept. at HCB. Here is his linkedin page:
Mohamed El Saiid | LinkedIn
I have attached the bloomberg documentation, and the logic behind the indicator
(page 57 of this pdf link --> http://ifta.org/public/files/journal/d_ifta_journal_12
Any thoughts on this? Do you think it can be implemented in MT4?
Has anyone heard of this VBE indicator? I played with it on a bloomberg terminal and found it to be quite useful.
It is created by Mohamed El Saiid, who is the Head of Technical Analysis Dept. at HCB. Here is his linkedin page:
Mohamed El Saiid | LinkedIn
I have attached the bloomberg documentation, and the logic behind the indicator
(page 57 of this pdf link --> http://ifta.org/public/files/journal/d_ifta_journal_12
Any thoughts on this? Do you think it can be implemented in MT4?iwillsurvive
It uses centered WMA - recalculates