Indicators: LinearRegressionLine
A Linear Regression Line is a straight line that best fits the prices between a starting price point and an ending price point. A "best fit" means that a line is constructed where there is the least amount of space between the price points and the actual Linear Regression Line.
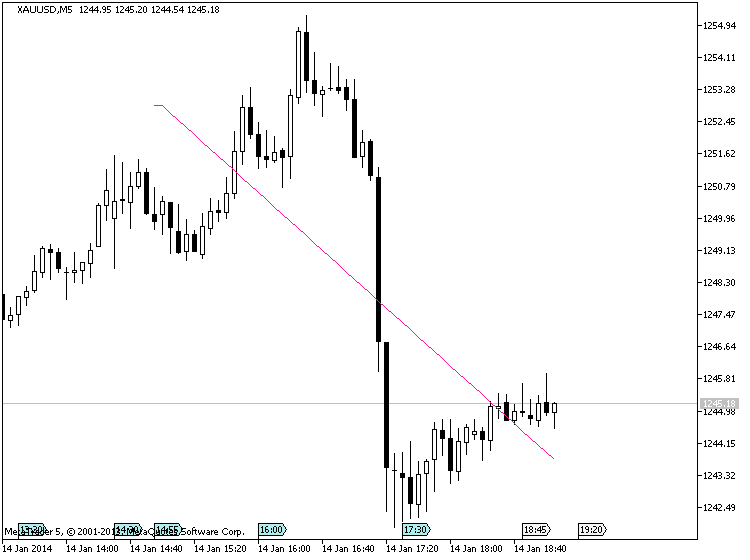
The Linear Regression Line is mainly used to determine trend direction. A chart of AT&T (T) stock is given below:
Traders usually view the Linear Regression Line as the fair value price for the future, stock, or forex currency pair. When prices deviate above or below, traders expect prices to go back towards the Linear Regression Line.
As a consequence, when prices are below the Linear Regression Line, this could be viewed as a good time to buy, and when prices are above the Linear Regression Line, a trader might sell. Of course other technical indicators would be used to confirm these inexact buy and sell signals.
A useful technical analysis charting indicator that uses a Linear Regression Line is the Linear Regression Channel (see: Linear Regression Channel), which gives more objective buy and sell signals based on price volatility.
- Free trading apps
- Over 8,000 signals for copying
- Economic news for exploring financial markets
You agree to website policy and terms of use
LinearRegressionLine:
Author: Nikolay Kositsin