USDCAD Technical Analysis 2016, 20.11 - 27.11: ranging bullish with 1.3551 resistance to be broker for 1.3588 re-enter target
Forum on trading, automated trading systems and testing trading strategies
Sergey Golubev, 2016.11.19 11:36
Weekly Fundamental Forecast for USD/CAD (based on the article)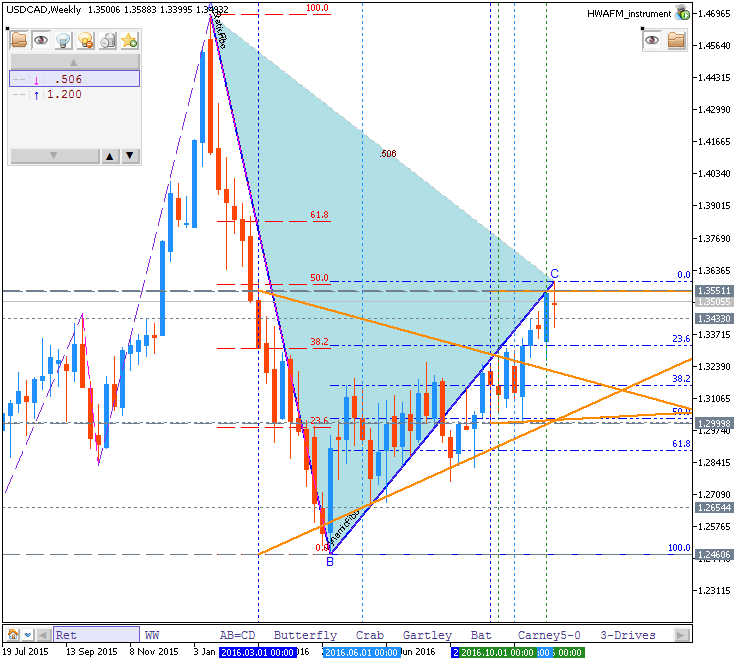
USD/CAD - "For the week ahead, Canadian data is relatively light as the U.S. goes on holiday on Thursday for Thanksgiving. Wholesale Sales are released on Monday, and Retail Sales on Tuesday in which a contraction of -.1% is expected. Perhaps more interesting in the immediate-future is how the Canadian Dollar responds to long-term support values (resistance on USD/CAD). The 1.3450-1.3550 zone has been a critical level in USD/CAD for a long time, providing a strong element of support in the mid-1990’s and, more recently as resistance in September of 2015 and then again over the past three weeks."
Forum on trading, automated trading systems and testing trading strategies
Sergey Golubev, 2016.11.22 09:32
Trading News Events: Canada Retail Sales (adapted from dailyfx)
- "A 0.6% rebound in Canada Retail Sales may spark a bullish reaction in the loonie and lead to a near-term pullback in USD/CAD should the data print highlight an improved outlook for growth and inflation."
- "Even though the Bank of Canada (BoC) keeps the door open to further embark on its easing-cycle, a marked pickup in household spending may encourage Governor Stephen Poloz and Co. to retain the current policy at the last 2016-meeting on December 7 as ‘Canada’s economy is still expected to grow at a rate above potential starting in the second half of 2016, supported by accommodative monetary and financial conditions and federal fiscal measures.’ Nevertheless, another disappointing sales report may push the BoC to ‘actively’ discuss additional measures in 2017 as the region is expected to return to full-capacity ‘materially later than the Bank had anticipated in July.’"
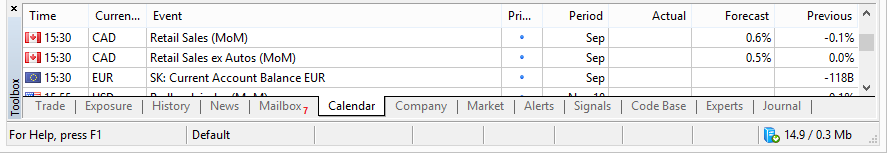
Bullish CAD Trade: Retail Spending Rebounds 0.6% or Greater
- "Need to see red, five-minute candle following the release to consider a short trade on USD/CAD."
- "If market reaction favors a long loonie trade, short USD/CAD with two separate position."
- "Set stop at the near-by swing high/reasonable distance from entry; look for at least 1:1 risk-to-reward."
- "Move stop to entry on remaining position once initial target is hit; set reasonable limit."
Bearish CAD Trade: Canada Household Spending Disappoints
- "Need green, five-minute candle to favor a long USD/CAD trade."
- "Implement same setup as the bullish Canadian dollar trade, just in reverse."
Daily price is on bullish are of the chart located to be above Ichimoku cloud. The price is on secondary correction to be started on open daily bar by 1.3386 support level to be broken for the correction to be continuing.
- If the price will break 1.3588 resistance level on close daily bar so the primary bullish trend will be resumed.
- If price will break 1.3386 support on close daily bar so the local downtrend as the secondary correction within the primary bullish trend will be started.
- If not so the price will be ranging within the levels.
------
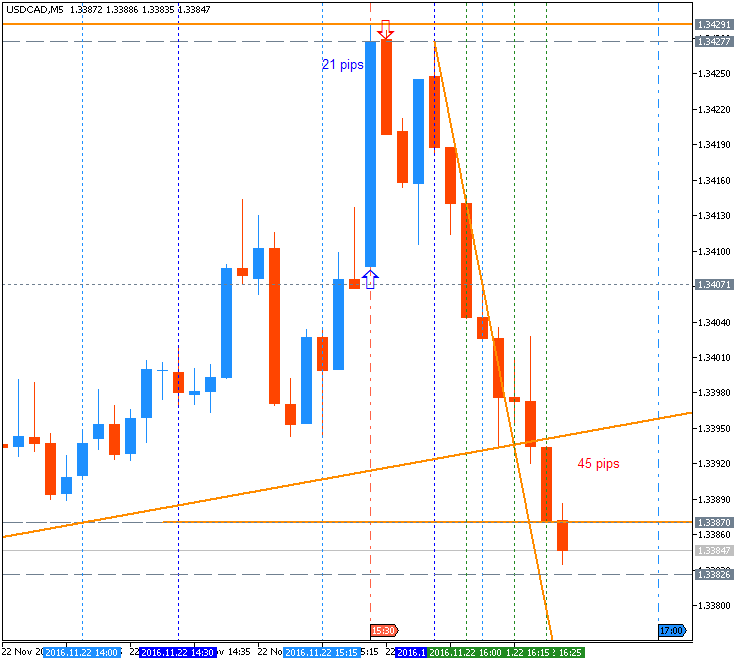
USD/CAD M5: range price movement by Canada Retail Sales news event
- Free trading apps
- Over 8,000 signals for copying
- Economic news for exploring financial markets
You agree to website policy and terms of use
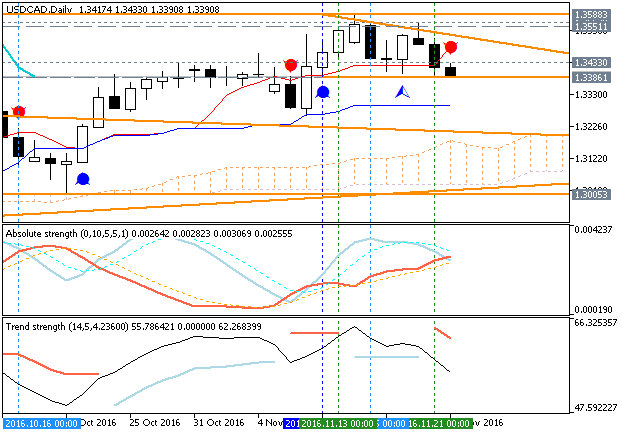
Daily price is located above Ichimoku cloud in the bullish area of the chart. The price is on ranging within the following support/resistance levels:
Trend Strength indicator is evaluating the trend as a bullish, and Absolute Strength indicator is estimating the future trend as the ranging bullish.
If D1 price breaks 1.3399 support level on close bar so the local downtrend as the secondary correction within the primary bullish trend will be started.
If D1 price breaks 1.2999 support level on close bar so we may see the reversal of the price movement from the ranging bullish to the primary bearish market condition.
If D1 price breaks 1.3551 resistance level on close bar from below to above so the primary bullish trend will be resumed with 1.3588 nearest daily target to re-enter.
If not so the price will be on bullish ranging within the levels.
SUMMARY: bullish
TREND: ranging