AUDUSD THIS WEEK
upppppppppp or range
Just a same question :
newdigital, 2013.12.07 19:06
Can you upload MT5 chart with all the indicators (as the links from MT5 CodeBase) so the people will understand it too?mitulbang:
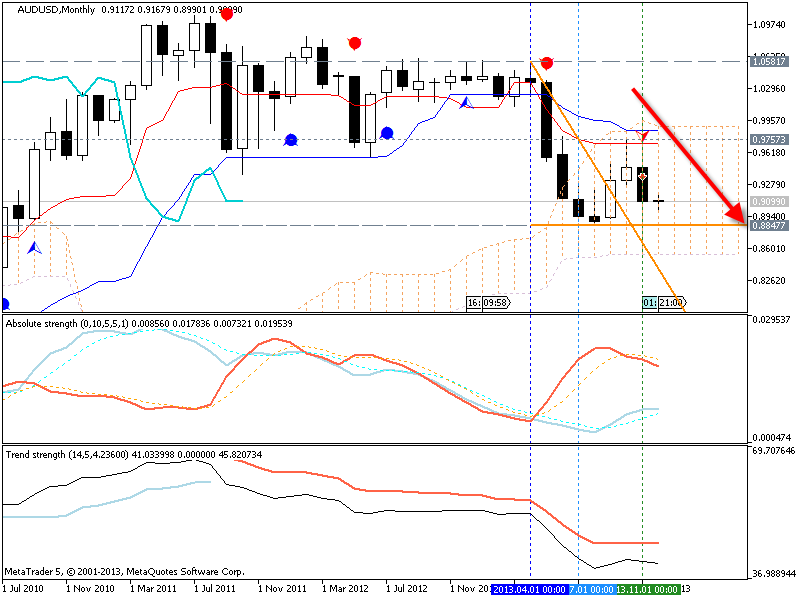
its going to touch 8850 in this month
You mean 88.50.
its going to touch 8850 in this month
0.8847 :
angevoyageur:
You mean 88.50.
0.8850
You mean 88.50.
I don't know what is going to touch but is still bearish on my 8H chart, but also close to kumo

In MT5
- right mouse click on the chart
- select Periodicity - Hours - 8 Hours
Rosiman:
I don't know what is going to touch but is still bearish on my 8H chart, but also close to kumo
yes, that's right - Chinkou Span line is very close to historical price for possible rally but it is still bearish as a primary trend for example :
MetaTrader Trading Platform Screenshots
MetaQuotes Software Corp., MetaTrader 5, Demo
temp_file_screenshot_34216.png

You are missing trading opportunities:
- Free trading apps
- Over 8,000 signals for copying
- Economic news for exploring financial markets
Registration
Log in
You agree to website policy and terms of use
If you do not have an account, please register