EURUSD Technical Analysis 08.12 - 15.12: Bullish Breakout?
newdigital, 2013.12.08 09:12
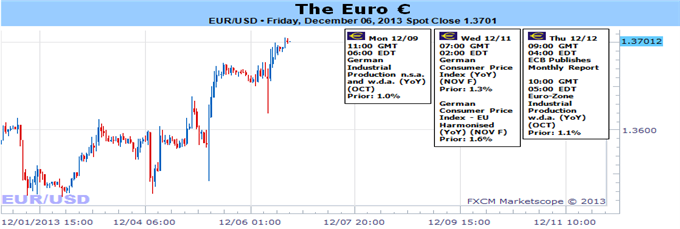
Fundamental Forecast for Euro: Neutral
- The ECB has signaled a significant monetary policy change of a return to stimulus
- Yet, short-term Euro-based rates continue to rebound, taking the Euro into a dangerous fundamental confrontation
- If you think an ECB stimulus return will eventually weigh the euro, consider a short
MetaTrader Trading Platform Screenshots
MetaQuotes Software Corp., MetaTrader 5, Demo
temp_file_screenshot_63332.png

newdigital, 2013.12.09 08:49
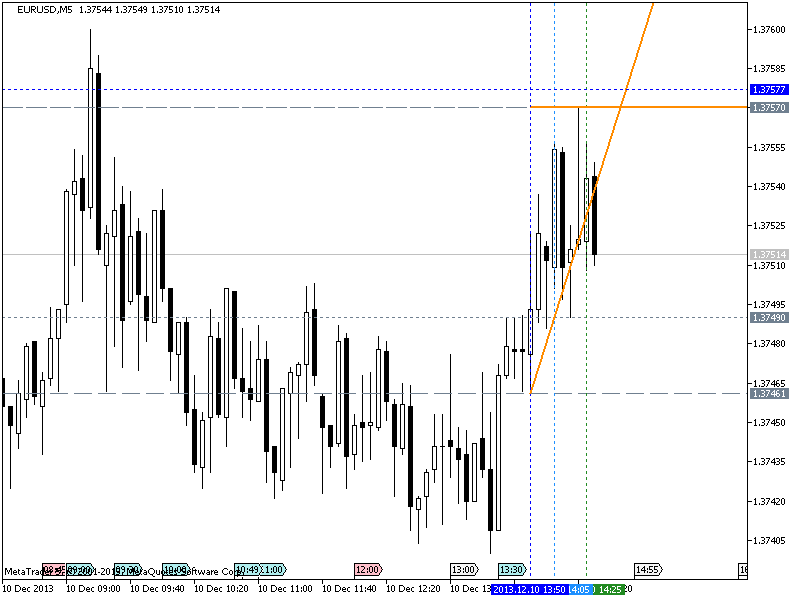
2013-12-09 07:00 GMT (or 08:00 MQ MT5 time) | [EUR - German Trade Balance]
- past data is 18.7B
- forecast data is 18.0B
- actual data is 16.8B according to the latest press release
if actual > forecast = good for currency (for EUR in our case)
==========
German Trade Surplus Falls More Than ForecastGermany's trade surplus declined more than expected in October, data from the Federal Statistical Office revealed Monday.
The trade surplus fell to EUR 17.9 billion in October from EUR 20.3 billion in September. Economists expected a decline to EUR 18.3 billion.
MetaTrader Trading Platform Screenshots
MetaQuotes Software Corp., MetaTrader 5, Demo
EURUSD M5 : +7/-8 pips movement by EUR - German Trade Balance news event

If the price will cross 1.3700 resistance level on D1 timeframe
support level so the bullish trend may be continuing for the next week.
If
the price will break 1.3832 resistance level on W1 timeframe so we can
condiser for the price for primary bullish cndition for the the next few
weeks fron now.
If the price will break 1.3619 support level from
above to below so ranging correction may be started to be continuing up
to the end of the week.
- Recommendation for long: watch the price for breaking 1.3700 resistance level on D1 timeframe for possible long
- Recommendation
to go short: n/a
- Trading Summary: ranging
New daily/weekly bar was opened above 1.3700 resistance and Chinkou Span line crossed historical price for possible breakout. But this Chinkou Span crossed it in almost horizontal way so I am not expecting big movement today sorry
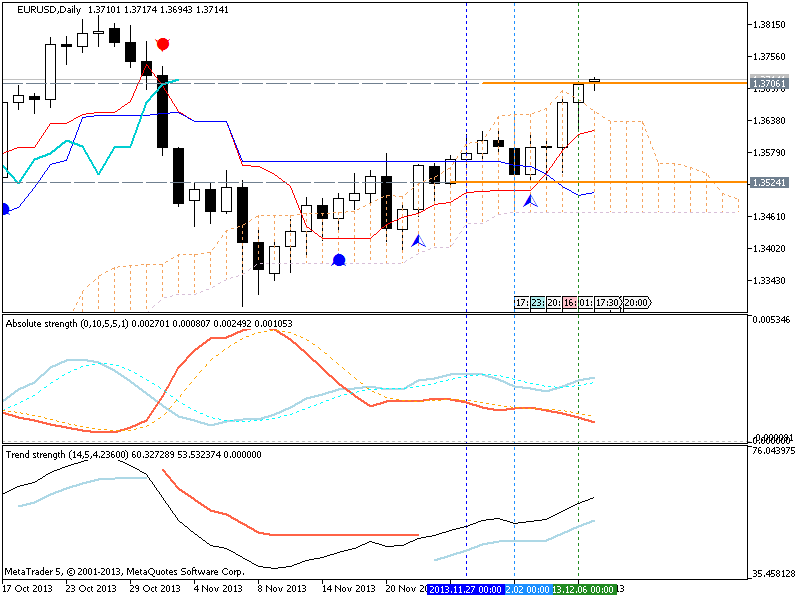
Breakout is going on for D1 timeframe :
about W1 - if the price will cross 1.3832 on close bar so we may see good breakout on weekly chart which may be going on up to New Year for example.
MetaTrader Trading Platform Screenshots
MetaQuotes Software Corp., MetaTrader 5, Demo
temp_file_screenshot_28656.png

have no idea 'why' but from what I know - the market is very volatile now. Why? :) Because of December. The traders are closing their positions to have some break for Christmas for example, and there is less liquidity on the market in December (less money involved than in other period of time). You can see this chart and will understand :
H4 chart update. still definitly bullish.

Just want to ask the members who are creating (and will create) technical analysis threads - please make your first post of the thread by doing some presentation for example - with chart, with text, if external text so it should be acccompanied with your text and so on. Just look at the first post of this thread as an example (by the way - i am not using external sources for my technical analysis threads).
I understand that some of you are not a specialists to be pofessional to make technical analysis - we all are learning here and sharing the knowledge ... but please understand - if you are setting/arranging/designing the first post of the thread so you are the setting the fashion of whole the thread and settings the level of the discussion on your thread.
Just a suggestion
Hi newdigital,
I do not know who you mean, in particular, but either way I want to clarify my position to all. I do not do technical analysis because i'm not capable. I use few indicators and from backtest i find the best parameters in the last 3 years that have given the best results. For me, this evaluation makes sense because I believe that the best parameters for the past probably could give similar results in the future. therefore my charts that i show are related to values different from technical analysis that has different principles.
- Free trading apps
- Over 8,000 signals for copying
- Economic news for exploring financial markets
You agree to website policy and terms of use
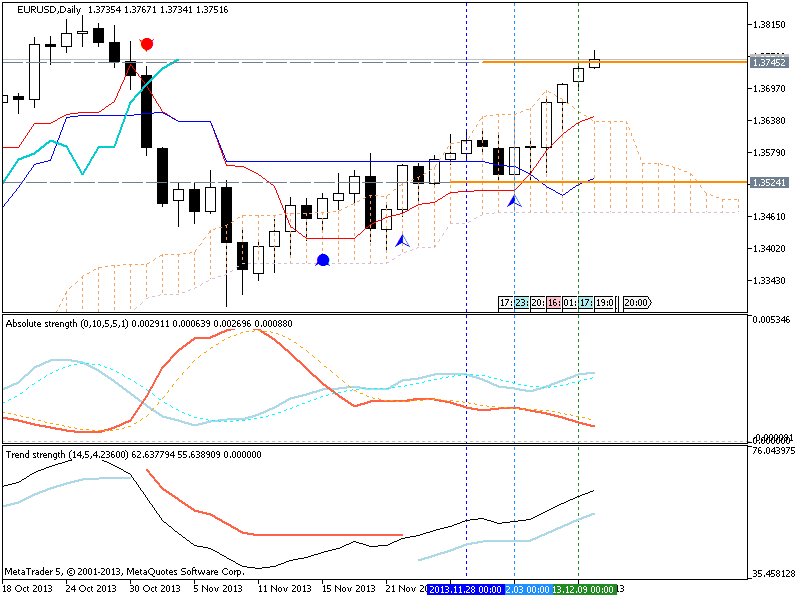
Chinkou Span line of Ichimoku indicator is trying to cross historical D1 price but on open bar only. Besides, D1 price is already above Sinkou Span A in bulliush zone for possible breaking 1.3677 resistance.
The primary bulish is started to be continuing on open bar only for H4 timeframe.
W1 timeframe - the price is ranging between 1.3832 resistance and 1.3295.
If the price will cross 1.3700 resistance level on D1 timeframe support level so the bullish trend may be continuing for the next week.
If the price will break 1.3832 resistance level on W1 timeframe so we can condiser for the price for primary bullish cndition for the the next few weeks fron now.
If the price will break 1.3619 support level from above to below so ranging correction may be started to be continuing up to the end of the week.
UPCOMING EVENTS (high/medium impacted news events which may be affected on EURUSD price movement for this coming week)
2013-12-09 01:30 GMT (or 02:30 MQ MT5 time) | [CNY - CPI]
2013-12-09 07:00 GMT (or 08:00 MQ MT5 time) | [EUR - German Trade Balance]
2013-12-10 05:30 GMT (or 06:30 MQ MT5 time) | [CNY - Industrial Production]
2013-12-10 12:00 GMT (or 13:00 MQ MT5 time) | [EUR - ECB President Draghi Speaks]
2013-12-11 07:00 GMT (or 08:00 MQ MT5 time) | [EUR - German CPI]
2013-12-12 08:00 GMT (or 09:00 MQ MT5 time) | [EUR - ECB President Draghi Speaks]
2013-12-12 13:30 GMT (or 14:30 MQ MT5 time) | [USD -Retail Sales]
2013-12-13 13:30 GMT (or 14:30 MQ MT5 time) | [USD - PPI]
Please note : some US (and CNY) high/medium impacted news events (incl speeches) are also affected on EURUSD price movement
SUMMARY : ranging
TREND : bullish
Intraday Chart